
메트로 마닐라
(마닐라 대도시에서 넘어옴)

Metropolitan Manila
Kalakhang Maynila | |
|---|---|
| National Capital Region | |
 Clockwise (from the top): Makati Central Business District, Fort Santiago, Cultural Center of the Philippines, Bonifacio Global City, Quezon Memorial Circle, Ortigas Center | |
 Location in the Philippines | |
| 좌표: 북위 14° 35′ 동경 121° 00′ / 북위 14.58° 동경 121° | |
| Country | |
| Island | Luzon |
| Managing entity | Metropolitan Manila Development Authority |
| Established | November 7, 1975[1] (as a metropolitan area) June 2, 1978[2] (as a region) |
| Composed of | |
| 정부 | |
| • 유형 | Metropolitan government under decentralized framework[3] |
| • Body | Metropolitan Manila Development Authority |
| • MMDA Chairman | Benjamin Abalos Jr.(PDP–Laban) |
| • Metro Manila Council Chairman | Edwin Olivarez (PDP–Laban) |
| 면적 | |
| • Region | 636.00 km2 (245.56 sq mi) |
| 인구 (오류: 시간이 잘못되었습니다. 인구 조사) [4] | |
| • Region | 13,484,462 |
| • 밀도 | 21,000명/km2 (55,000명/sq mi) |
| • 도시 | 24,100,000 (agglomeration, not metropolitan area) |
| 데모님 | English: Manilan; Spanish: manilense,틀:Efn-la manileño(-a) Tagalog: Manileño(-a), Manilenyo(-a), Taga-Maynila |
| 시간대 | UTC+8 (PST) |
| 틀:Areacodestyle | +63 (0)2 |
| ISO 3166 코드 | PH-00 |
| GDP (2020) | ₱5.8 trillion $121 billion[6] |
| Growth rate | |
| HDI | |
| HDI rank | 2nd (2019) |
| 웹사이트 | mmda |
| 틀:Notelist-la | |
메트로 마닐라(타갈로그어: Kalakhang Maynila, Kamaynilaan, 영어: Metro Manila 메트로 마닐라[*]), 마닐라 수도권(타갈로그어: Pambansang Punong Rehiyon; 영어: National Capital Region, NCR)은 인구 1000만이 넘는 필리핀 유일의 대도시 (Metropolis) 지역이다. 11,553,427명의 인구(2007년 8월 1일 인구조사)가 거주하며 교외 지역인 라구나 주, 카비테 주, 리살 주, 불라칸 주까지 "Greater Metro Manila"라고 불린다.
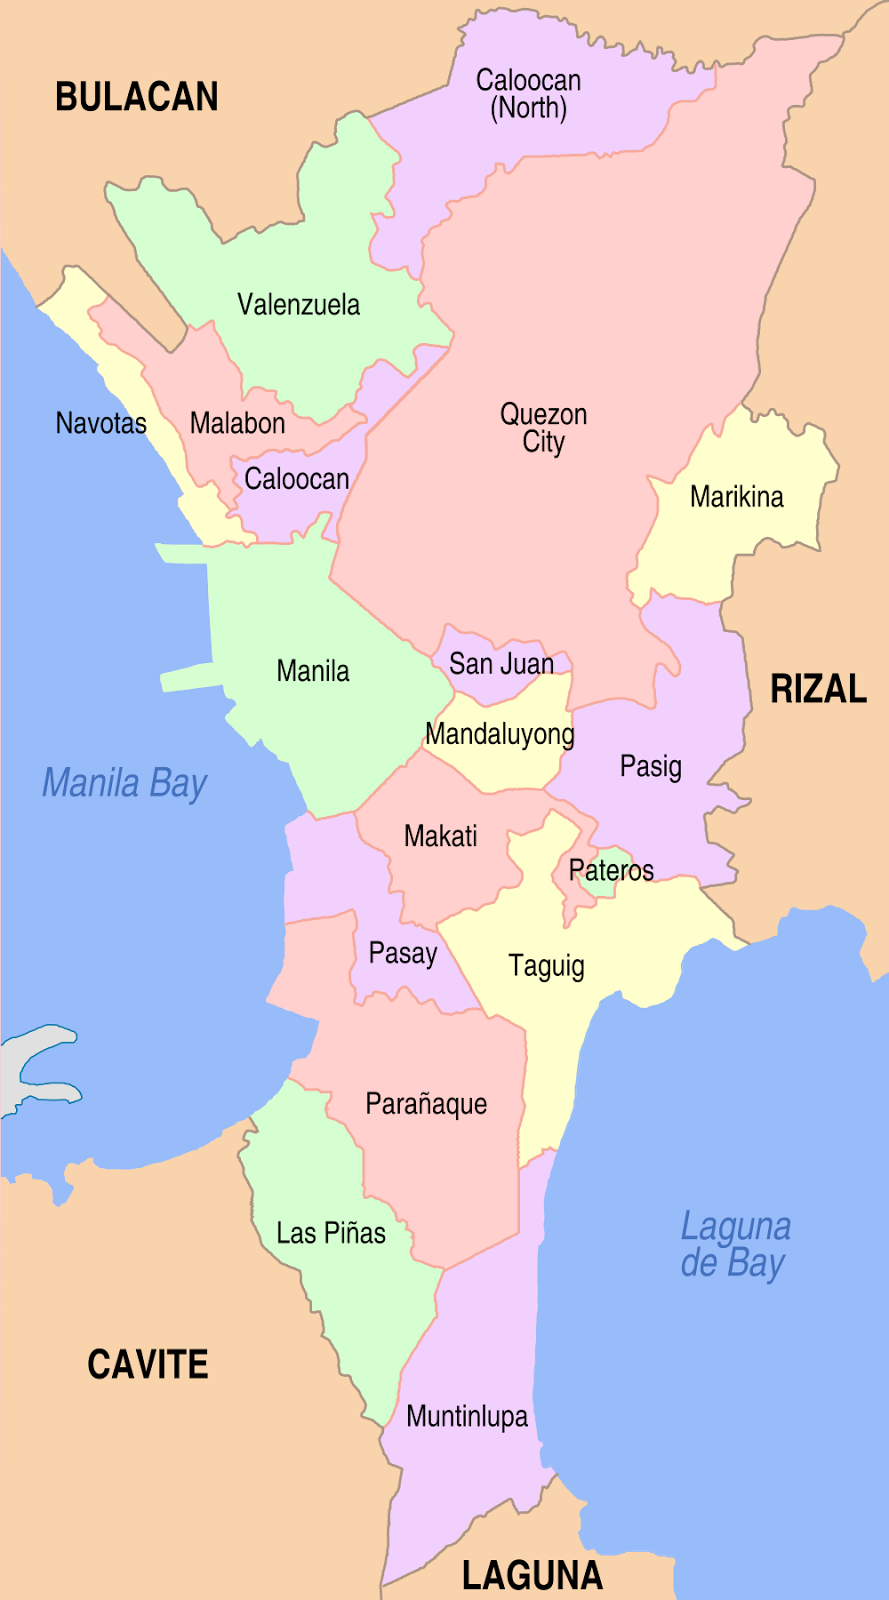
필리핀 대통령령 940호에 의해 1976년 6월 24일 필리핀의 수도를 퀘존 시에서 행정수도 마닐라 (Manila)로 변경하면서, 대부분의 정부청사와 교육기관이 밀집한 필리핀 최대 도시 퀘손(Quezon) 시, 공장 지대와 금융 지대를 아우루는 파식(Pasig) 시, 마닐라만을 따라 호텔과 공항 터미널이 위치한 말라테(Malate) 시와 파사이(Pasay) 시를 포함하는 총 16개의 도시(City)와 1개의 자치시(Municipality)를 필리핀의 수도(NCR: National Capital Region)로 지정하였다.[8]지도 참조
기후[편집]
| Port Area, Manila (1981–2010, extremes 1885–2012)의 기후 | |||||||||||||
|---|---|---|---|---|---|---|---|---|---|---|---|---|---|
| 월 | 1월 | 2월 | 3월 | 4월 | 5월 | 6월 | 7월 | 8월 | 9월 | 10월 | 11월 | 12월 | 연간 |
| 최고 기온 기록 °C (°F) | 36.5 (97.7) |
35.6 (96.1) |
36.8 (98.2) |
38.0 (100.4) |
38.6 (101.5) |
37.6 (99.7) |
36.5 (97.7) |
35.6 (96.1) |
35.3 (95.5) |
35.8 (96.4) |
35.6 (96.1) |
34.6 (94.3) |
38.6 (101.5) |
| 평균 일 최고 기온 °C (°F) | 29.6 (85.3) |
30.6 (87.1) |
32.1 (89.8) |
33.5 (92.3) |
33.2 (91.8) |
32.2 (90.0) |
31.2 (88.2) |
30.8 (87.4) |
31.0 (87.8) |
31.1 (88.0) |
30.9 (87.6) |
29.8 (85.6) |
31.3 (88.3) |
| 일 평균 기온 °C (°F) | 26.7 (80.1) |
27.4 (81.3) |
28.7 (83.7) |
30.1 (86.2) |
30.0 (86.0) |
29.3 (84.7) |
28.5 (83.3) |
28.3 (82.9) |
28.4 (83.1) |
28.4 (83.1) |
28.0 (82.4) |
27.0 (80.6) |
28.4 (83.1) |
| 평균 일 최저 기온 °C (°F) | 23.8 (74.8) |
24.2 (75.6) |
25.3 (77.5) |
26.6 (79.9) |
26.9 (80.4) |
26.4 (79.5) |
25.9 (78.6) |
25.8 (78.4) |
25.7 (78.3) |
25.7 (78.3) |
25.1 (77.2) |
24.2 (75.6) |
25.5 (77.9) |
| 최저 기온 기록 °C (°F) | 14.5 (58.1) |
15.6 (60.1) |
16.2 (61.2) |
17.2 (63.0) |
20.0 (68.0) |
20.1 (68.2) |
19.4 (66.9) |
18.0 (64.4) |
20.2 (68.4) |
19.5 (67.1) |
16.8 (62.2) |
15.7 (60.3) |
14.5 (58.1) |
| 평균 강우량 mm (인치) | 17.3 (0.68) |
14.2 (0.56) |
15.8 (0.62) |
23.7 (0.93) |
147.2 (5.80) |
253.5 (9.98) |
420.5 (16.56) |
432.4 (17.02) |
355.1 (13.98) |
234.8 (9.24) |
121.7 (4.79) |
67.4 (2.65) |
2,103.6 (82.82) |
| 평균 강우일수 (≥ 0.1 mm) | 4 | 3 | 3 | 4 | 10 | 17 | 21 | 21 | 20 | 17 | 12 | 7 | 139 |
| 평균 상대 습도 (%) | 72 | 69 | 67 | 66 | 71 | 76 | 79 | 81 | 80 | 78 | 75 | 74 | 74 |
| 평균 월간 일조시간 | 177 | 198 | 226 | 258 | 223 | 162 | 133 | 133 | 132 | 158 | 153 | 152 | 2,105 |
| 출처 1: PAGASA[9][10] | |||||||||||||
| 출처 2: Danish Meteorological Institute (sun, 1931–1960)[11] | |||||||||||||
인구[편집]
| 연도 | 인구 | ±% p.a. |
|---|---|---|
| 1903 | 328,939 | — |
| 1918 | 461,166 | +2.28% |
| 1939 | 993,889 | +3.72% |
| 1948 | 1,569,128 | +5.20% |
| 1960 | 2,462,488 | +3.83% |
| 1970 | 3,966,695 | +4.88% |
| 1975 | 4,970,006 | +4.63% |
| 1980 | 5,925,884 | +3.58% |
| 1990 | 7,948,392 | +2.98% |
| 1995 | 9,454,040 | +3.30% |
| 2000 | 9,932,560 | +1.06% |
| 2007 | 11,566,325 | +2.12% |
| 2010 | 11,855,975 | +0.90% |
| 2015 | 12,877,253 | +1.59% |
| 2020 | 13,484,462 | +0.91% |
| Source: Philippine Statistics Authority[12][13] [4] | ||
경제[편집]
마닐라 대도시의 빈곤율
같이 보기[편집]
각주[편집]
- ↑ “Presidential Decree No. 824 November 7, 1975”. 《lawphil.net》. Arellano Law Foundation. 2016년 3월 12일에 원본 문서에서 보존된 문서. 2014년 1월 14일에 확인함.
- ↑ “Presidential Decree No. 1396, s. 1978”. 《Official Gazette of the Republic of the Philippines》. 2018년 3월 6일에 원본 문서에서 보존된 문서. 2015년 9월 22일에 확인함.
- ↑ Manasan, Rosario; Mercado, Ruben (February 1999). “Governance and Urban Development: Case Study of Metro Manila” (PDF). 《Philippine Institute for Development Studies Discussion Paper Series》 (99–03). 2018년 12월 16일에 원본 문서 (PDF)에서 보존된 문서. 2018년 12월 15일에 확인함.
- ↑ 가 나 인구 조사 (2015). 〈National Capital Region (NCR)〉. 《Total Population by Province, City, Municipality and Barangay》. PSA. 20 jun 2016에 확인함.
- ↑ “The Principal Agglomerations of the World”. 《citypopulation.de》. 2018년 9월 13일에 원본 문서에서 보존된 문서. 2017년 12월 8일에 확인함.
- ↑ 가 나 “Gross Regional Domestic Product”. 《openstat.psa.gov.ph》. Philippine Statistics Authority. 2021년 5월 20일에 확인함.
- ↑ “Gender and Special Population Groups; Provincial Human Development Index”. 《Philippine Statistics Authority》. 2020년 6월 17일에 원본 문서에서 보존된 문서. 2021년 1월 12일에 확인함.
- ↑ Presidential Decree No. 940
- ↑ “Port Area Manila Climatological Normal Values”. Philippine Atmospheric, Geophysical and Astronomical Services Administration. 2018년 9월 19일에 원본 문서에서 보존된 문서. 2018년 9월 19일에 확인함.
- ↑ “Port Area Manila Climatological Extremes”. Philippine Atmospheric, Geophysical and Astronomical Services Administration. 2018년 9월 19일에 원본 문서에서 보존된 문서. 2018년 9월 19일에 확인함.
- ↑ Cappelen, John; Jensen, Jens. “Filippinerne - Manila, Luzon” (PDF). 《Climate Data for Selected Stations (1931-1960)》 (덴마크어). Danish Meteorological Institute. 2013년 4월 27일에 원본 문서 (PDF)에서 보존된 문서. 2018년 9월 19일에 확인함.
- ↑ “2010 Census of Population and Housing: National Capital Region” (PDF). Philippine Statistics Authority of the Republic of the Philippines. 2012년 6월 25일에 원본 문서 (PDF)에서 보존된 문서. 2012년 4월 6일에 확인함.
- ↑ “National Capital Region. Total Population by Province, City, Municipality and Barangay: as of May 1, 2010” (PDF). Philippine Statistics Authority of the Philippines. 2012년 11월 15일에 원본 문서 (PDF)에서 보존된 문서. 2012년 12월 22일에 확인함.
- ↑ “Poverty incidence (PI):”. Philippine Statistics Authority. 2020년 12월 28일에 확인함.
- ↑ “Estimation of Local Poverty in the Philippines” (PDF). 2005년 11월 29일.
- ↑ “2009 Official Poverty Statistics of the Philippines” (PDF). 2011년 2월 8일.
- ↑ “Annual Per Capita Poverty Threshold, Poverty Incidence and Magnitude of Poor Population, by Region and Province: 1991, 2006, 2009, 2012 and 2015”. 2016년 8월 27일.
- ↑ “Annual Per Capita Poverty Threshold, Poverty Incidence and Magnitude of Poor Population, by Region and Province: 1991, 2006, 2009, 2012 and 2015”. 2016년 8월 27일.
- ↑ “Annual Per Capita Poverty Threshold, Poverty Incidence and Magnitude of Poor Population, by Region and Province: 1991, 2006, 2009, 2012 and 2015”. 2016년 8월 27일.
- ↑ “Updated Annual Per Capita Poverty Threshold, Poverty Incidence and Magnitude of Poor Population with Measures of Precision, by Region and Province: 2015 and 2018”. 2020년 6월 4일.
외부 링크[편집]
| 수도 |  | ||||
|---|---|---|---|---|---|
| 군도 | |||||
| 지방 |
| ||||
| 주 |
| ||||