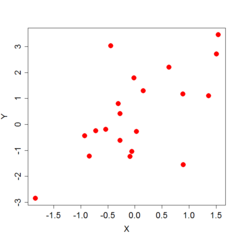
산점도: 두 판 사이의 차이
내용 삭제됨 내용 추가됨
편집 요약 없음 |
편집 요약 없음 |
||
| 1번째 줄: | 1번째 줄: | ||
[[파일:Scatter_plot.png|thumb|240px|산점도 |
[[파일:Scatter_plot.png|thumb|240px|두변수 X,Y간의 산점도 예]] |
||
'''산점도'''(scatter plot, scatterplot, scatter graph, scatter chart, scattergram, scatter diagram)는 [[직교 좌표계]]를 이용해 두 개 변수 간의 관계를 나타내는 방법이다. |
'''산점도'''(scatter plot, scatterplot, scatter graph, scatter chart, scattergram, scatter diagram)는 [[직교 좌표계]]를 이용해 두 개 변수 간의 관계를 나타내는 방법이다. |
||

