
파일:Canadian Oil Production 1960 to 2020.png
최대 해상도입니다.
Canadian_Oil_Production_1960_to_2020.png (500 × 500 픽셀, 파일 크기: 7 KB, MIME 종류: image/png)
파일 설명
| 설명 |
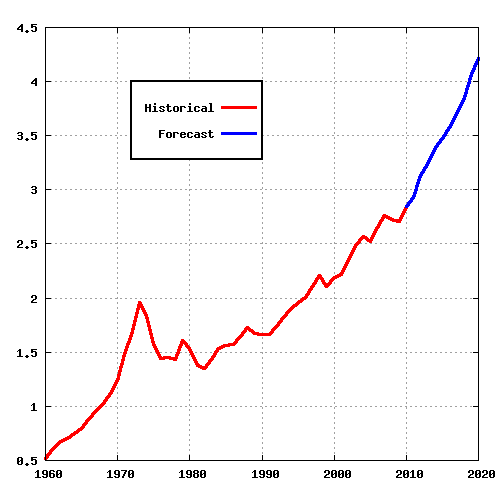
English: Plot of Canadian oil production from 1960 to 2005 generated using Excel using data from the Canadian National Energy Board (NEB) and the Canadian Association of Petroleum Producers (CAPP)
Norsk bokmål: Graf over Canadias oljeproduksjon fra 1960 til 2005, generert ved hjelp av Microsoft Excel, med data fra Canadas nasjonale energibyrå og Canadas Association of Petroleum Producers (CAPP) |
|||
| 날짜 | ||||
| 출처 |
1947-1970: CAPP, Statistical Handbook, Production, Table 03-01A Canadian Crude Oil Production* 1971-2010: CAPP, Statistical Handbook, Production, Table 03-16A Canadian Crude Oil & Equivalent Production by Type 2011-2025: CAPP Forecast, Canadian Crude Oil Forecast and Market Outlook Report 2011 [1], Appendix B.1 |
|||
| 저자 | David Moe RockyMtnGuy | |||
| 다른 버전 |
|


Gnuplot
Version 4.4 patchlevel 3
# Use "term svg" instead of "term png" to obtain SVG image
#set term svg size 500,500 dynamic font "sans-serif"
set term png transparent truecolor size 500,500

set autoscale xfix
set grid
set size square
set style data lines
set key at first 1990, first 4 width 2 height 2 spacing 2\
    box linetype rgb "#000000" lw 2

# Convert to million barrels/day
Scale(year) = (year <= 1970 ) ? (1e6 * 365 * 0.158987294928) :\
                  (year <= 2010 ) ? (1e3 * 0.158987294928) : 1e3

plot \
 "ca.txt" using (($1>=1960 && $1<=2010)?$1:1/0):($2/Scale($1)) title "Historical" lw 3 linetype rgb "#ff0000", \
 "ca.txt" using (($1>=2010 && $1<=2020)?$1:1/0):($2/Scale($1)) title "Forecast" lw 3 linetype rgb "#0000ff"
Data file "ca.txt"
1947	1158319
1948	1890410
1949	3338860
1950	4552120
1951	7553797
1952	9719164
1953	12836804
1954	15248976
1955	20540684
1956	27294347
1957	28782815
1958	26169162
1959	29176005
1960	30131861
1961	35067100
1962	38804871
1963	41012263
1964	43628218
1965	46382724
1966	50795201
1967	55705729
1968	59384593
1969	64764598
1970	71887333
1971	235
1972	269.4
1973	311.4
1974	292.6
1975	250.5
1976	229.2
1977	230.1
1978	227.1
1979	255.9
1980	244.2
1981	219.4
1982	214.7
1983	228.2
1984	243.5
1985	249.1
1986	249.9
1987	261.1
1988	274.3
1989	266.3
1990	264.9
1991	264.8
1992	275.6
1993	289.8
1994	300.9
1995	311.7
1996	318.2
1997	334.4
1998	351.1
1999	334.5
2000	348.2
2001	352.6
2002	373
2003	394.7
2004	408.9
2005	400.7
2006	421.8
2007	439.5
2008	433
2009	429.8
2010	452.5
2011	2934
2012	3137
2013	3239
2014	3389
2015	3479
2016	3577
2017	3697
2018	3857
2019	4062
2020	4210
2021	4364
2022	4462
2023	4557
2024	4646
2025	4737
라이선스

|
GNU 자유 문서 사용 허가서 1.2판 또는 자유 소프트웨어 재단에서 발행한 이후 판의 규정에 따라 본 문서를 복제하거나 개작 및 배포할 수 있습니다. 본 문서에는 변경 불가 부분이 없으며, 앞 표지 구절과 뒷 표지 구절도 없습니다. 본 사용 허가서의 전체 내용은 GNU 자유 문서 사용 허가서 부분에 포함되어 있습니다. |
| 이 파일은 크리에이티브 커먼즈 저작자표시-동일조건변경허락 3.0 Unported 라이선스로 배포됩니다. | ||
| ||
| 이 라이선스 틀은 GFDL 라이선스 변경의 일부로 이 파일에 추가되었습니다. |
파일 역사
날짜/시간 링크를 클릭하면 해당 시간의 파일을 볼 수 있습니다.
| 날짜/시간 | 섬네일 | 크기 | 사용자 | 설명 | |
|---|---|---|---|---|---|
| 현재 | 2011년 8월 9일 (화) 15:07 | | 500 × 500 (7 KB) | Iorsh | Updated for 2010 |
| 2008년 6월 20일 (금) 20:27 |  | 500 × 500 (8 KB) | Solbu | {{Information |Description={{en|1=Plot of Canadian oil production from 1960 to 2005 generated using Excel using data from the Canadian National Energy Board (NEB) and the Canadian Association of Petroleum Producers (CAPP)}} {{no|1=Graf over Canadias oljep |
이 파일을 사용하는 문서
다음 문서 1개가 이 파일을 사용하고 있습니다: