
파일:Botswana-demography.svg

SVG 파일의 PNG 형식의 미리보기 크기: 750 × 450 픽셀. 다른 해상도: 320 × 192 픽셀 | 640 × 384 픽셀 | 1,024 × 614 픽셀 | 1,280 × 768 픽셀 | 2,560 × 1,536 픽셀
원본 파일 (SVG 파일, 실제 크기 750 × 450 픽셀, 파일 크기: 10 KB)
파일 설명
| 설명 |
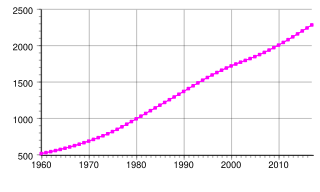
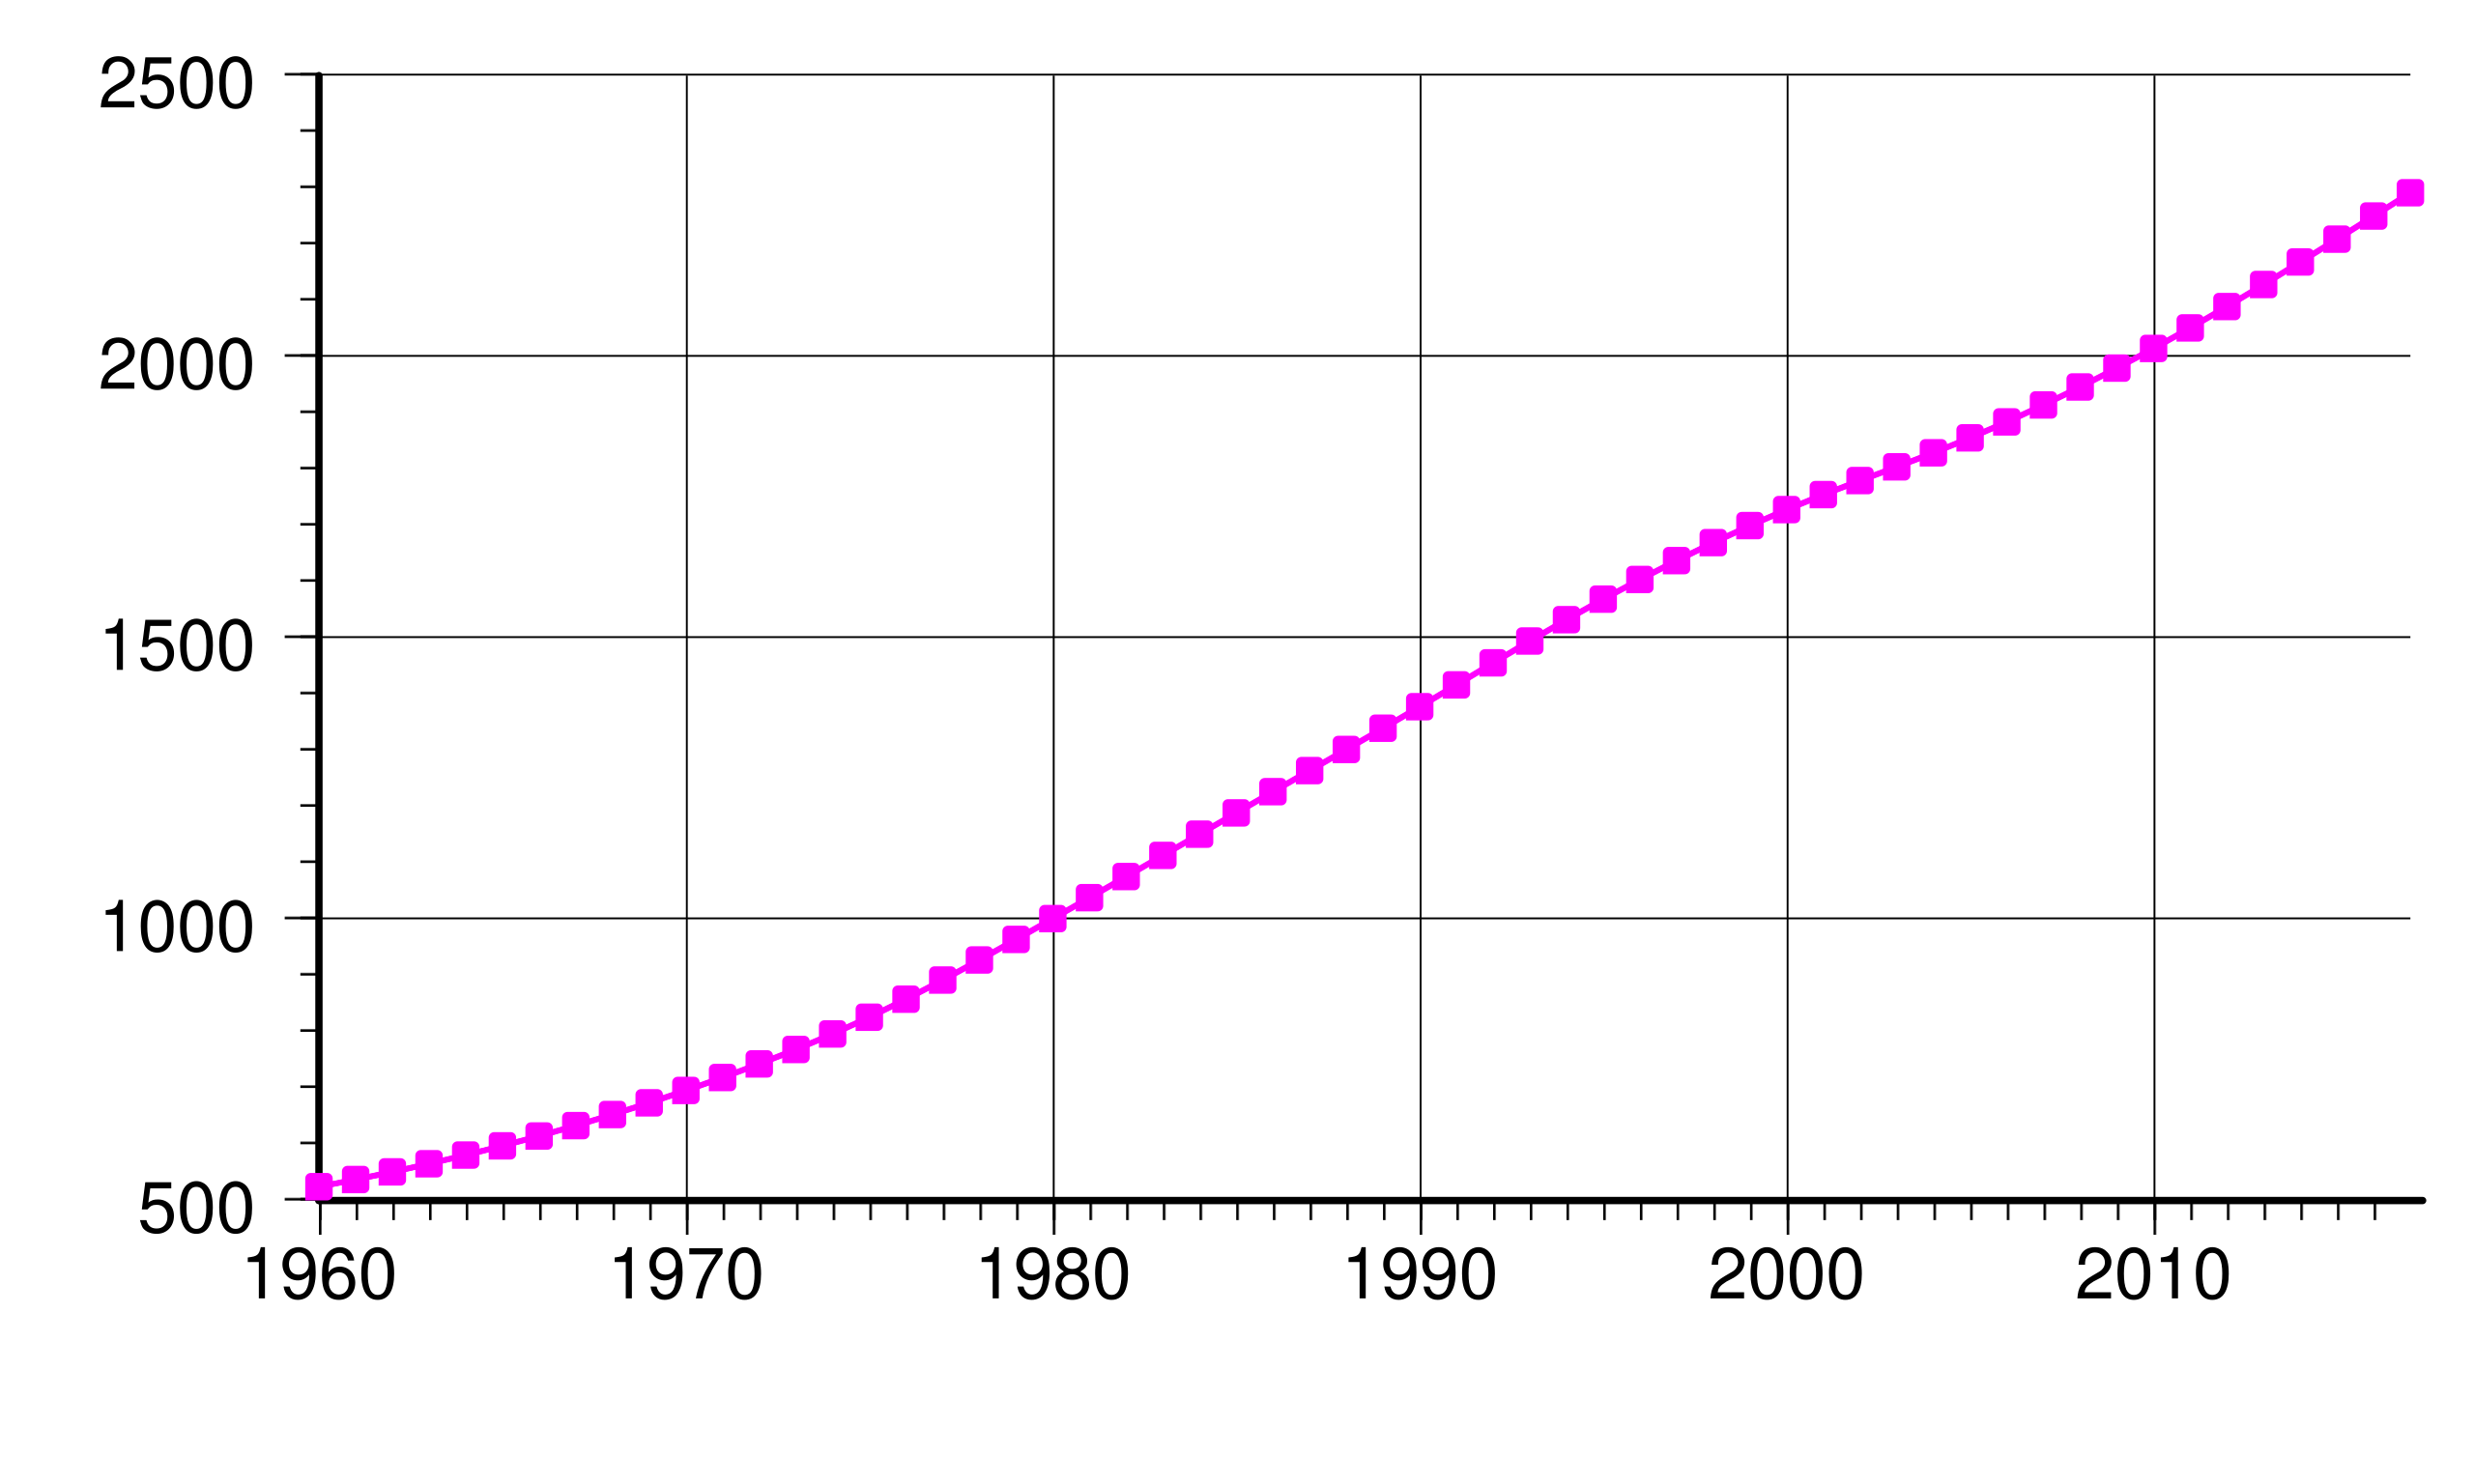
English: Botswana population (1960-2017). From UN estimates, World Population Prospects: The 2017 Revision Y-axis : Number of inhabitants in thousands. |
| 날짜 | |
| 출처 | 자작 |
| 저자 | Patricia.fidi, Demmo |
Generated with Wikimedia SVG Chart
| Data format | The source data of the chart is in the SVG image file in a clearly readable format. You see the original numbers inside of the SVG file in the form of a list such as this:
... 1995 10.06 1996 11.75 1997 12.45 ... |
| Content of SVG | To view the data download the SVG file itself. To do so right-click this link, and then choose the option to save: File:Botswana-demography.svg. Launch any text editor. Open the downloaded SVG file with the text editor (usually; file menu, open). To see the list of data, search for the phrase id="graph1". |
| Please, do not use a special SVG editor such as Inkscape; the readability of the database would be destroyed. You can edit the SVG file with any text editor, for example; en: List of text editors. You can view the edited SVG file in various web browsers. As of 2011, all major desktop browsers, and many minor ones, have some level of SVG support. See: en: Scalable Vector Graphics#Support for SVG in web browsers. When satisfied with your edits, upload the edited SVG file with the link labeled "Upload a new version of this file".
W3C-validity not checked. This chart was created with Wikimedia SVG Chart. 이 SVG 파일은 내장된 문자열을 사용하고 있으며, 숫자만을 사용하고 있습니다. |
|
| Code to generate SVG | See: File talk:Botswana-demography.svg. Documentation see: Wikimedia SVG Chart. |
라이선스
| 나는 이 작품의 저작권자로서, 이 작품을 퍼블릭 도메인으로 모두에게 공개합니다. 이 공개 선언은 전 세계적으로 유효합니다. 만약 저작권의 포기가 법률적으로 가능하지 않은 경우, 나는 이 작품을 법적으로 허용되는 한도 내에서 누구나 자유롭게 어떤 목적으로도 제한없이 사용할 수 있도록 허용합니다. |
Gnuplot
Version 4.2 patchlevel 5
set term svg size 800,500 dynamic font "sans-serif"
set autoscale xfix
set grid
set style data linespoints
set pointsize 0.6
unset key

plot "population.txt" linetype rgb "#FF00FF" pt 5
Data file "population.txt"
1950	413
1951	425
1952	437
1953	448
1954	459
1955	470
1956	480
1957	490
1958	501
1959	512
1960	524
1961	537
1962	550
1963	564
1964	580
1965	596
1966	613
1967	631
1968	651
1969	671
1970	693
1971	716
1972	740
1973	765
1974	793
1975	822
1976	854
1977	888
1978	923
1979	960
1980	996
1981	1033
1982	1070
1983	1107
1984	1145
1985	1183
1986	1222
1987	1261
1988	1300
1989	1340
1990	1380
1991	1420
1992	1460
1993	1500
1994	1539
1995	1576
1996	1612
1997	1646
1998	1678
1999	1708
2000	1737
2001	1763
2002	1787
2003	1810
2004	1836
2005	1864
2006	1896
2007	1930
2008	1968
2009	2007
2010	2048
2011	2090
2012	2133
2013	2177
2014	2220
2015	2262
파일 역사
날짜/시간 링크를 클릭하면 해당 시간의 파일을 볼 수 있습니다.
| 날짜/시간 | 섬네일 | 크기 | 사용자 | 설명 | |
|---|---|---|---|---|---|
| 현재 | 2017년 10월 31일 (화) 03:12 | | 750 × 450 (10 KB) | Delphi234 | legend |
| 2017년 10월 31일 (화) 03:09 |  | 750 × 450 (10 KB) | Delphi234 | 2017 | |
| 2016년 2월 17일 (수) 13:38 |  | 750 × 450 (10 KB) | Delphi234 | 2015 | |
| 2009년 10월 9일 (금) 00:31 |  | 512 × 320 (17 KB) | Demmo | Updated until year 2008 | |
| 2006년 12월 26일 (화) 04:14 |  | 705 × 422 (66 KB) | Patricia.fidi | ||
| 2006년 12월 26일 (화) 04:12 |  | 705 × 422 (66 KB) | Patricia.fidi |
이 파일을 사용하는 문서
다음 문서 1개가 이 파일을 사용하고 있습니다:
이 파일을 사용하고 있는 모든 위키의 문서 목록
다음 위키에서 이 파일을 사용하고 있습니다:
- af.wikipedia.org에서 이 파일을 사용하고 있는 문서 목록
- bg.wikipedia.org에서 이 파일을 사용하고 있는 문서 목록
- cy.wikipedia.org에서 이 파일을 사용하고 있는 문서 목록
- da.wikipedia.org에서 이 파일을 사용하고 있는 문서 목록
- de.wikipedia.org에서 이 파일을 사용하고 있는 문서 목록
- en.wikipedia.org에서 이 파일을 사용하고 있는 문서 목록
- es.wikipedia.org에서 이 파일을 사용하고 있는 문서 목록
- fr.wikipedia.org에서 이 파일을 사용하고 있는 문서 목록
- hu.wikipedia.org에서 이 파일을 사용하고 있는 문서 목록
- it.wikipedia.org에서 이 파일을 사용하고 있는 문서 목록
- mk.wikipedia.org에서 이 파일을 사용하고 있는 문서 목록
- pt.wikipedia.org에서 이 파일을 사용하고 있는 문서 목록
- tr.wikipedia.org에서 이 파일을 사용하고 있는 문서 목록
- uk.wikipedia.org에서 이 파일을 사용하고 있는 문서 목록