
파일:Simpson's paradox continuous.svg

SVG 파일의 PNG 형식의 미리보기 크기: 390 × 260 픽셀. 다른 해상도: 320 × 213 픽셀 | 640 × 427 픽셀 | 1,024 × 683 픽셀 | 1,280 × 853 픽셀 | 2,560 × 1,707 픽셀
원본 파일 (SVG 파일, 실제 크기 390 × 260 픽셀, 파일 크기: 18 KB)
W3C-validity not checked.
파일 설명
| 설명 |
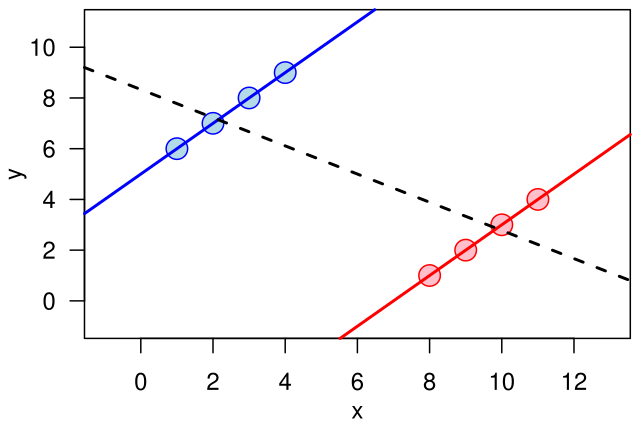
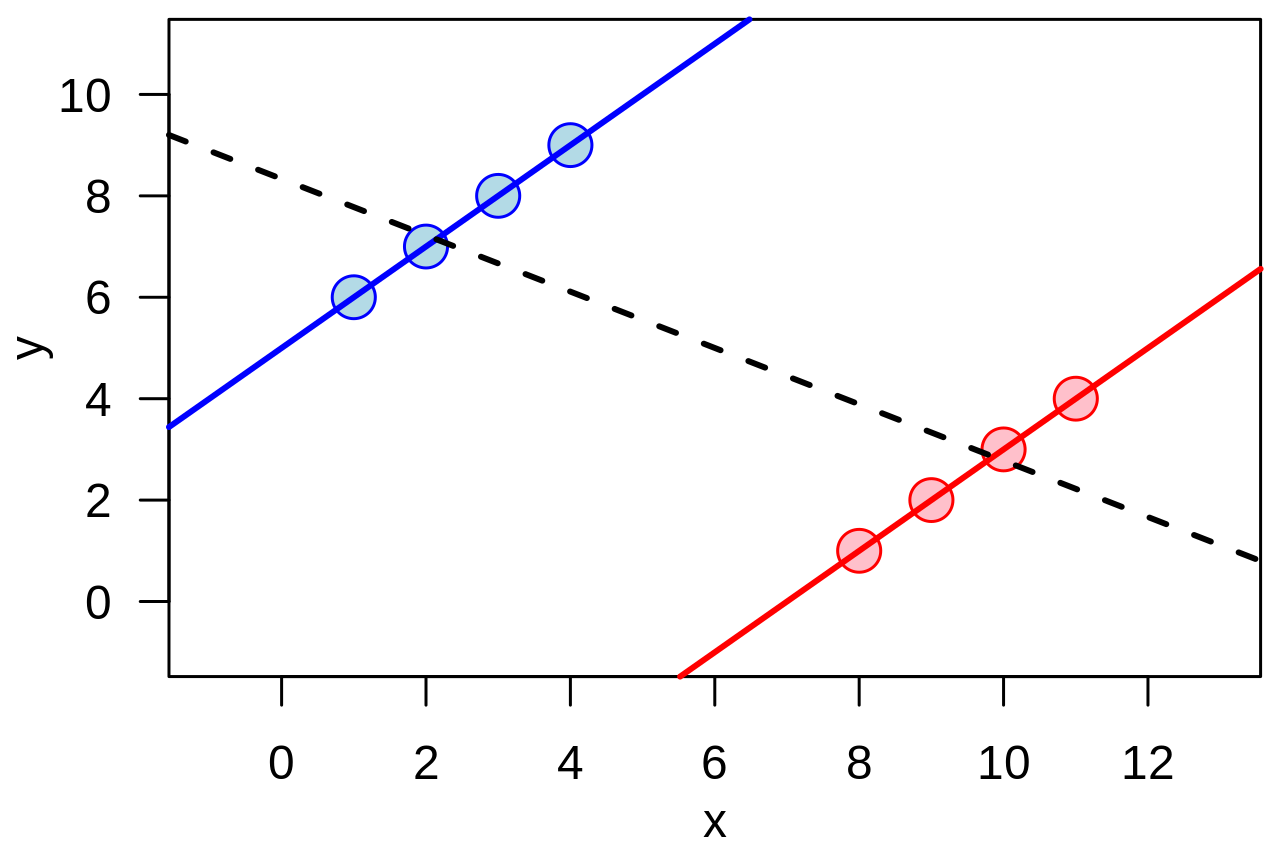
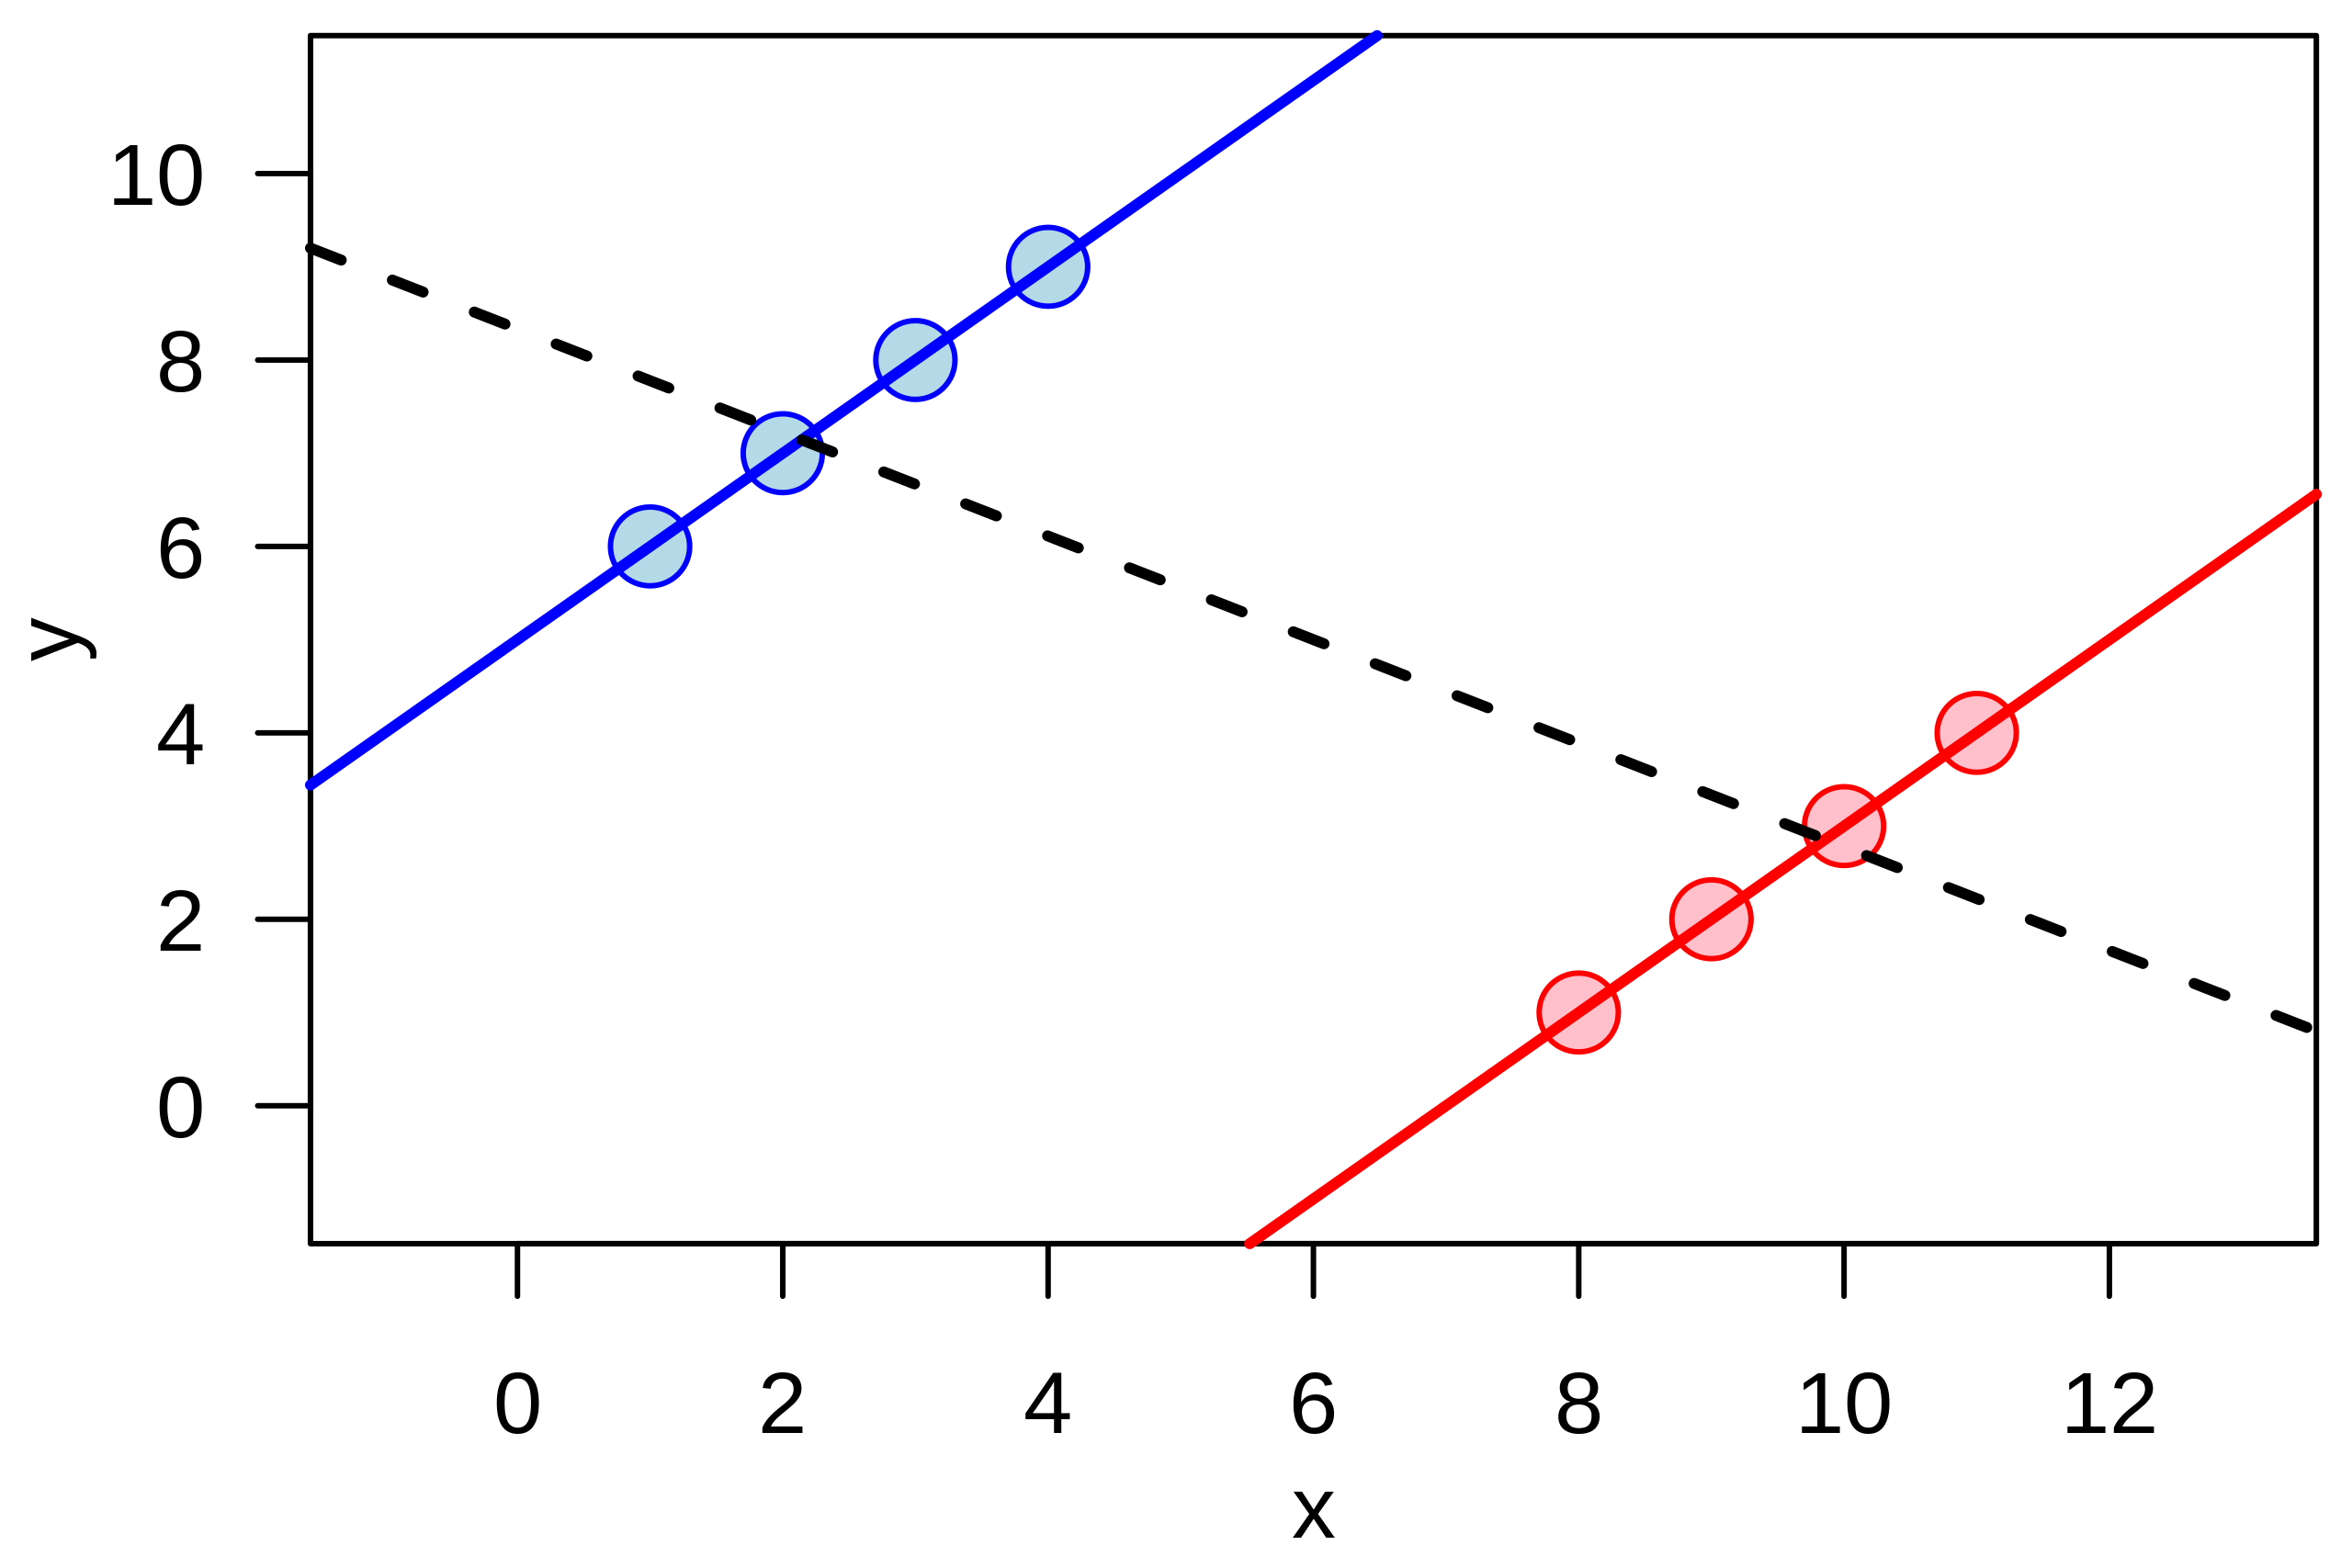
English: Illustration of the quantitative version of en:Simpson's paradox: a positive trend appears for two separate groups (blue and red), whereas a negative trend (black, dashed) appears when the groups are combined. |
| 날짜 | |
| 출처 | 자작 |
| 저자 | Schutz |
Example of the quantitative version of w:Simpson's paradox.
The graphic was created by User:Schutz for Wikipedia on 14 June 2007, using the R statistical project. The program that generated and exported the graphic is given below; the uploaded version was generated slightly differently to workaround a bug during the PS to SVG conversion with pstoedit command. The layout was slightly modified using Inkscape before upload.
  x1 <- c(1,2,3,4)
  y1 <- x1 + 5

  x2 <- x1 + 7
  y2 <- x2 - 7

  x <- c(x1,x2)
  y <- c(y1,y2)

  postscript("simpson.eps", paper="special", width=4.5, height=3)

  par(las=1)
  par(mar=c(3,3,0.5,0.5))
  par(mgp=c(2,1,0))

  plot(x,y, cex=2, pch=21,
       col=rep(c("blue", "red"), each=4), bg=rep(c("lightblue", "pink"), each=4),
       xlim=range(x)+c(-2,2), ylim=range(y)+c(-2,2))
  abline(lm(y1 ~ x1), col="blue", lwd=2)
  abline(lm(y2 ~ x2), col="red", lwd=2)
  abline(lm(y  ~ x), lwd=2, lty=2)

  dev.off()
라이선스
| 이 작품은 저작자인 I, Schutz에 의해 퍼블릭 도메인으로 공개된 작품입니다. 이 공개 선언은 전 세계적으로 유효합니다. 만약 저작권의 포기가 법률적으로 가능하지 않은 경우, I, Schutz은 이 작품을 법적으로 허용되는 한도 내에서 누구나 자유롭게 어떤 목적으로도 제한 없이 사용할 수 있도록 허용합니다. |
파일 역사
날짜/시간 링크를 클릭하면 해당 시간의 파일을 볼 수 있습니다.
| 날짜/시간 | 섬네일 | 크기 | 사용자 | 설명 | |
|---|---|---|---|---|---|
| 현재 | 2007년 6월 14일 (목) 08:15 | | 390 × 260 (18 KB) | Schutz | {{Information |Description=Illustration of the continuous version of Simpson's paradox |Source=self-made |Date=14 June 2007 |Author=Schutz }} Example of the continuous version of w:Simpson's paradox. The graphic was created by [[User |
이 파일을 사용하는 문서
다음 문서 1개가 이 파일을 사용하고 있습니다:
이 파일을 사용하고 있는 모든 위키의 문서 목록
다음 위키에서 이 파일을 사용하고 있습니다:
- ar.wikipedia.org에서 이 파일을 사용하고 있는 문서 목록
- ca.wikipedia.org에서 이 파일을 사용하고 있는 문서 목록
- cs.wikipedia.org에서 이 파일을 사용하고 있는 문서 목록
- cy.wikipedia.org에서 이 파일을 사용하고 있는 문서 목록
- de.wikipedia.org에서 이 파일을 사용하고 있는 문서 목록
- en.wikipedia.org에서 이 파일을 사용하고 있는 문서 목록
- es.wikipedia.org에서 이 파일을 사용하고 있는 문서 목록
- eu.wikipedia.org에서 이 파일을 사용하고 있는 문서 목록
- fi.wikipedia.org에서 이 파일을 사용하고 있는 문서 목록
- fr.wikipedia.org에서 이 파일을 사용하고 있는 문서 목록
- he.wikipedia.org에서 이 파일을 사용하고 있는 문서 목록
- nl.wikipedia.org에서 이 파일을 사용하고 있는 문서 목록
- no.wikipedia.org에서 이 파일을 사용하고 있는 문서 목록
- pl.wikipedia.org에서 이 파일을 사용하고 있는 문서 목록
- pt.wikipedia.org에서 이 파일을 사용하고 있는 문서 목록
- ru.wikipedia.org에서 이 파일을 사용하고 있는 문서 목록
- sk.wikipedia.org에서 이 파일을 사용하고 있는 문서 목록
- ta.wikipedia.org에서 이 파일을 사용하고 있는 문서 목록
- uk.wikipedia.org에서 이 파일을 사용하고 있는 문서 목록
- vi.wikipedia.org에서 이 파일을 사용하고 있는 문서 목록
- www.wikidata.org에서 이 파일을 사용하고 있는 문서 목록
- zh.wikipedia.org에서 이 파일을 사용하고 있는 문서 목록