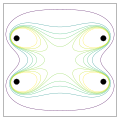
Source code has been modified into fully object-oriented matplotlib interface. It now uses the "viridis" colormap, instead of "jet" which produces perceptual glitches. Besides, some changes had to be done to work with versions of numpy more recent than the one originally used.
##########
## Code for the figure
##########
# -*- coding: utf-8 -*-
from __future__ import division

import matplotlib.pyplot as plt
import numpy as np

from matplotlib.cm import viridis as colormap  # future default colormap

"""
Setup
"""
r = 1.0
res = 200  # grid resolution. 100 may be enough, resulting in smaller SVG file)

def dist3(a, b, c, d, e, f):
    """Compute the Euclidian distance from (d, e, f) to (a, b, c),
    raised to the 3rd power (and with lower boundary `r`).
    """
    return np.maximum(r, np.sqrt((a - d)**2 + (b - e)**2 + (c - f)**2))

x = np.linspace(-150, 150, res)
y = np.linspace(-150, 150, res)
X, Y = np.meshgrid(x, y)
F = np.zeros((res, res, 3))

"""
Computing part
"""
# Loop over two coils
for coils in [1.0, -1.0]:
    # Sum field contributions from coil in 10-degree steps
    for p in np.arange(0, 360, 10):
        xc = 100 * np.sin(np.pi * p / 180.0)
        yc = 50 * coils
        zc = 100 * np.cos(np.pi * p / 180.0)
        MAG = 1.0 / ((r + dist3(X, Y, 0.0, xc, yc, zc))**3)
        # (We leave out the necessary constants that would be required
        # to get proper units because only scaling behavior will be shown
        # in the plot. This is also why a sum instead of an integral
        # can be used.)
        #
        # Due to more stringent casting rules in recent Numpy (>=1.10),
        # one builds an explicit list of all the vectors (X - xc, Y - yc, -zc)
        # instead of relying on broadcasting. One then reshapes the array Z
        # (of the cross-product results) as previously expected.
        vectors = np.array([[xval - xc, yval - yc, -zc] for (xval, yval)
                            in zip(X.reshape(-1), Y.reshape(-1))])
        Z = np.cross(vectors, (-zc, 0.0, xc))
        Z = Z.reshape(res, res, 3)
        F += Z * MAG[:,:,np.newaxis]

# Compute the B-field
B = np.sqrt(F[..., 0]**2 + F[..., 1]**2 + F[..., 2]**2)
# Scale field strength by value at center
B = B / B[res // 2, res // 2]

"""
Plotting part
"""
fig_label = "helmoltz_coils"
plt.close(fig_label)
fig, ax = plt.subplots(figsize=(6, 6), num=fig_label, frameon=False)

levels = (0.5, 0.8, 0.9, 0.95, 0.99, 1.01, 1.05, 1.1)
cs = ax.contour(x, y, B, cmap=colormap, levels=levels)

# Add wire symbols
ax.scatter((100, 100, -100, -100), (50, -50, 50, -50), s=400, color="Black")

ax.axis((-130, 130, -130, 130))
ax.set_xticks([])
ax.set_yticks([])

plt.tight_layout()
plt.show()

fig.savefig("Helmholtz_coil,_B_magnitude_cross_section.svg")
##########


