
파일:Graphic data for World Record Progression in Men and Women Swimming 50m-100m-200m.png

미리 보기 크기: 800 × 526 픽셀 다른 해상도: 320 × 210 픽셀 | 640 × 421 픽셀 | 1,024 × 673 픽셀 | 1,280 × 842 픽셀 | 2,560 × 1,683 픽셀 | 3,162 × 2,079 픽셀
원본 파일 (3,162 × 2,079 픽셀, 파일 크기: 783 KB, MIME 종류: image/png)

|
이 그림 파일은 벡터 SVG 형식으로 다시 만들어야 합니다. SVG의 장점에 대해서는 여기(영어)를 참고해 주십시오. 만약 이 그림의 SVG 버전이 이미 존재한다면 이 틀을 {{vector version available|새 파일 이름.svg}}으로 대체해 주십시오.
|
파일 설명
| 설명 |
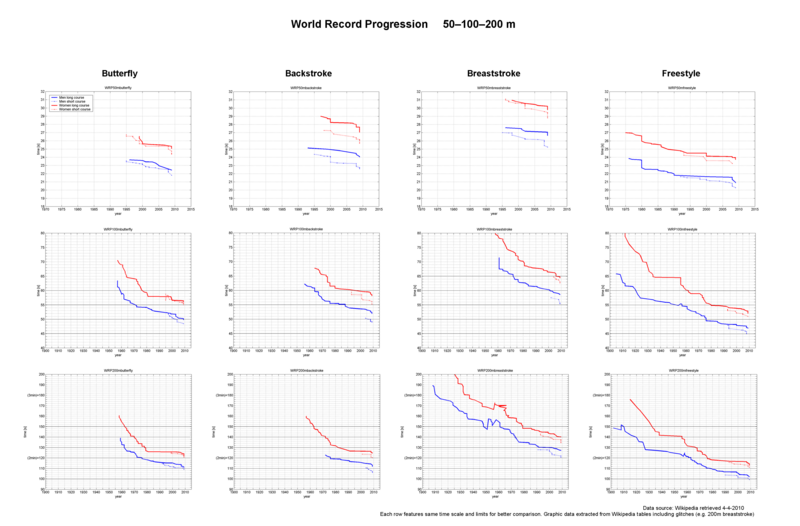
English: Graphic data for World Record Progression in Men and Women Swimming 50m-100m-200m Long and Short Course Butterfly-Backstroke-Breaststroke-Freestyle. Original table data retrieved from Wikipedia (including glitches e.g. as found in 200m breaststroke) on 2010-04-04
Except source data, this is original work by the author |
| 날짜 | |
| 출처 | 자작 |
| 저자 | Krfx |
author typed own code in Matlab (R) (~Octave) to retrieve data from Wikipedia World Record Progression tables like http://en.wikipedia.org/wiki/World_record_progression_100_metres_freestyle
Use the code to produce further graphic data according to procedure written in code remarks
Code is free for anyone to copy, redistribute, modify, etc. without any links to the author
function [yr,ti]=pooldata(datafile)
% this is matlab code (~octave) i wrote myself for everyone to use and transform table data into graphics data
% according to the following procedure and context:
%
% reads data from datafile (.txt file) containing a formatted "ctrl+c" copy from wikipedia "record progression" table style
% as found e.g. in http://en.wikipedia.org/wiki/World_record_progression_100_metres_freestyle
% each line in datafile should be similar to this one:
% 1 	 53.46  		Almsick , Franziska van Franziska van Almsick 	 Germany 	01993-01-06 6 January 1993 	World Cup 	China, Shanghai ?  People's Republic of China Shanghai, China
% (the '%' sign at the beginning of the line is for matlab remark purposes, should not be on actual .txt file)
% copy the whole table (men long course, short, women long, short) and separate each subtable with a blank line
%
% if you simply do a ctrl+c copy from the table itself on the wiki page and ctrl+v into notepad, you should
% hit nearly this format. sometimes you may get a double line for a single entry: to make it a single line,
% just backspace once at the beginning of the second line

%lstyle is a string with color and linestyle data for the plot command (see matlab specs)

% sample call:
% pooldata('WRP100mbreaststroke.txt');

% feel free to modify, copy, redistribute this code without any reference to its author, provided you make
% some job in transforming wiki table data into graphic data


lstyle={'.-b','.:b','.-r','.:r'};

fid=fopen(datafile,'rt');
ee=1;
ct=1;
ctype=1;
while ee
   a=fgetl(fid);
   ischar(a)
   if ischar(a)
      if ~isempty(a)
	      %warning: the following takes out ':' from string data if time is equal or more than 1'
   	   %this is valid only for the specific format
      	tt=str2num(strrep(a(6:14),':',''));
      	%tt=str2num(strrep(a(1:7),':','')); % use this alternate formula depending on where the time "column" is found on the table
      	tt=floor(tt/100)*60+mod(tt,100);%works out actual seconds

      	ti(ct)=tt;%stores time for this entry
      	ii=findstr(a,'-');yr(ct)=str2num(a(ii(1)-4:ii(1)-1));%looks for a year data marker on the string and stores the year (see how this is coded on the .txt file)
	  	   %ii=findstr(a,',');yr(ct)=str2num(a(ii(1)+2:ii(1)+5));%alternate formula depending on how the data is coded (see how this is coded on the .txt file)
      	ct=ct+1;
   	else
         lll=a;
         plot(yr,ti,lstyle{ctype},'linewidth',2)
         hold on
         ctype=ctype+1;ct=1;
         clear yr ti
   	end
   else
      ee=0;
      plot(yr,ti,lstyle{ctype},'linewidth',2)
   end
end

fclose(fid);
grid on
hold on
axis([1900 2015 90 200])
set(gca,'ytick',[90:2:200])
set(gca,'xtick',[1900:5:2015])
set(gca,'YTickLabel',{'90','','','','','100','','','','','110','','','','','(2min)=120','','','','','130','','','','','140','','','','','150','','','','','160','','','','','170','','','','','(3min)=180','','','','','190','','','','','200'})
set(gca,'XTickLabel',{'1900','','1910','','1920','','1930','','1940','','1950','','1960','','1970','','1980','','1990','','2000','','2010',''})

%add these last lines when you're done
title(datafile(1:end-4))
ylabel('time [s]')
xlabel('year')
%legend('Men long course','Men short course','Women long course','Women short course') %legend depends on the data you put (of course)
라이선스
| 나는 이 작품의 저작권자로서, 이 작품을 퍼블릭 도메인으로 모두에게 공개합니다. 이 공개 선언은 전 세계적으로 유효합니다. 만약 저작권의 포기가 법률적으로 가능하지 않은 경우, 나는 이 작품을 법적으로 허용되는 한도 내에서 누구나 자유롭게 어떤 목적으로도 제한없이 사용할 수 있도록 허용합니다. |
파일 역사
날짜/시간 링크를 클릭하면 해당 시간의 파일을 볼 수 있습니다.
| 날짜/시간 | 섬네일 | 크기 | 사용자 | 설명 | |
|---|---|---|---|---|---|
| 현재 | 2010년 4월 4일 (일) 21:40 | | 3,162 × 2,079 (783 KB) | Krfx | {{Information |Description={{en|1=Graphic data for World Record Progression in Men and Women Swimming 50m-100m-200m Long and Short Course Butterfly-Backstroke-Breaststroke-Freestyle. Original table data retrieved from Wikipedia (including glitches e.g. as |
이 파일을 사용하는 문서
다음 문서 2개가 이 파일을 사용하고 있습니다:
이 파일을 사용하고 있는 모든 위키의 문서 목록
다음 위키에서 이 파일을 사용하고 있습니다:
- en.wikipedia.org에서 이 파일을 사용하고 있는 문서 목록
- World record progression 50 metres freestyle
- World record progression 200 metres butterfly
- World record progression 100 metres butterfly
- World record progression 100 metres breaststroke
- World record progression 100 metres freestyle
- World record progression 200 metres freestyle
- World record progression 50 metres backstroke
- World record progression 100 metres backstroke
- World record progression 200 metres backstroke
- World record progression 50 metres butterfly
- World record progression 50 metres breaststroke
- World record progression 200 metres breaststroke
- History of swimming
- ru.wikipedia.org에서 이 파일을 사용하고 있는 문서 목록
- uk.wikipedia.org에서 이 파일을 사용하고 있는 문서 목록
- Хронологія світових рекордів з плавання на дистанції 50 метрів вільним стилем
- Хронологія світових рекордів з плавання на дистанції 100 метрів вільним стилем
- Хронологія світових рекордів з плавання на дистанції 200 метрів вільним стилем
- Хронологія світових рекордів з плавання на дистанції 50 метрів на спині
- Хронологія світових рекордів з плавання на дистанції 50 метрів брасом
- Хронологія світових рекордів з плавання на дистанції 50 метрів батерфляєм
- Хронологія світових рекордів з плавання на дистанції 100 метрів на спині
- Хронологія світових рекордів з плавання на дистанції 200 метрів на спині
- Хронологія світових рекордів з плавання на дистанції 100 метрів брасом
- Хронологія світових рекордів з плавання на дистанції 200 метрів брасом
- Хронологія світових рекордів з плавання на дистанції 100 метрів батерфляєм
- Хронологія світових рекордів з плавання на дистанції 200 метрів батерфляєм