본문으로 이동

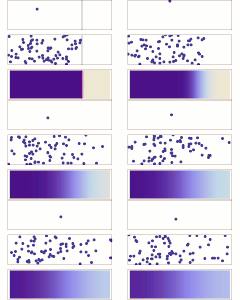
파일:DiffusionMicroMacro.gif

문서 내용이 다른 언어로는 지원되지 않습니다.
위키백과, 우리 모두의 백과사전.

DiffusionMicroMacro.gif(360 × 300 픽셀, 파일 크기: 402 KB, MIME 종류: image/gif, 반복됨, 60 프레임, 6.5 s)

이 그림은 벡터 그래픽 버전(SVG)이 있습니다. 래스터(비트맵) 그림 대신 벡터 그래픽 그림을 사용하는 것이 좋습니다.

File:DiffusionMicroMacro.gif → File:DiffusionMicroMacro.svg

벡터 그래픽에 대한 자세한 설명은 SVG 파일로 변환하기(영어) 문서를 참고해 주세요.
미디어위키의 SVG 그림 지원 정보(영어)도 같이 참고해주세요.

다른 언어로
Alemannisch  Bahasa Indonesia  Bahasa Melayu  British English  català  čeština  dansk  Deutsch  eesti  English  español  Esperanto  euskara  français  Frysk  galego  hrvatski  Ido  italiano  lietuvių  magyar  Nederlands  norsk bokmål  norsk nynorsk  occitan  Plattdüütsch  polski  português  português do Brasil  română  Scots  sicilianu  slovenčina  slovenščina  suomi  svenska  Tiếng Việt  Türkçe  vèneto  Ελληνικά  беларуская (тарашкевіца)  български  македонски  нохчийн  русский  српски / srpski  татарча/tatarça  українська  ქართული  հայերեն  বাংলা  தமிழ்  മലയാളം  ไทย  한국어  日本語  简体中文  繁體中文  עברית  العربية  فارسی  +/−
새 SVG 이름

파일 설명

설명
English: Diffusion from a microscopic and macroscopic point of view. Initially, there are solute molecules on the left side of a barrier (magenta line) and none on the right. The barrier is removed, and the solute diffuses to fill the whole container. Top: A single molecule moves around randomly. Middle: With more molecules, there is a clear trend where the solute fills the container more and more evenly. Bottom: With an enormous number of solute molecules, the randomness is gone: The solute appears to move smoothly and systematically from high-concentration areas to low-concentration areas, following Fick's laws. Image is made in Mathematica, source code below.
날짜
출처 자작
저자 Sbyrnes321

라이선스

Public domain 나는 이 작품의 저작권자로서, 이 작품을 퍼블릭 도메인으로 모두에게 공개합니다. 이 공개 선언은 전 세계적으로 유효합니다.
만약 저작권의 포기가 법률적으로 가능하지 않은 경우,
나는 이 작품을 법적으로 허용되는 한도 내에서 누구나 자유롭게 어떤 목적으로도 제한없이 사용할 수 있도록 허용합니다.

<< Mathematica source code >>

(* Source code written in Mathematica 6.0, by Steve Byrnes, 2010.
I release this code into the public domain. Sorry it's messy...email me any questions. *)

(*Particle simulation*)
SeedRandom[1];
NumParticles = 70;
xMax = 0.7;
yMax = 0.2;
xStartMax = 0.5;
StepDist = 0.04;
InitParticleCoordinates = Table[{RandomReal[{0, xStartMax}], RandomReal[{0, yMax}]}, {i, 1, NumParticles}];
StayInBoxX[x_] := If[x < 0, -x, If[x > xMax, 2 xMax - x, x]];
StayInBoxY[y_] := If[y < 0, -y, If[y > yMax, 2 yMax - y, y]];
StayInBoxXY[xy_] := {StayInBoxX[xy[[1]]], StayInBoxY[xy[[2]]]};
StayInBarX[x_] := If[x < 0, -x, If[x > xStartMax, 2 xStartMax - x, x]];
StayInBarY[y_] := If[y < 0, -y, If[y > yMax, 2 yMax - y, y]];
StayInBarXY[xy_] := {StayInBarX[xy[[1]]], StayInBarY[xy[[2]]]};
MoveAStep[xy_] := StayInBoxXY[xy + {RandomReal[{-StepDist, StepDist}], RandomReal[{-StepDist, StepDist}]}];
MoveAStepBar[xy_] := StayInBarXY[xy + {RandomReal[{-StepDist, StepDist}], RandomReal[{-StepDist, StepDist}]}];
NextParticleCoordinates[ParticleCoords_] := MoveAStep /@ ParticleCoords;
NextParticleCoordinatesBar[ParticleCoords_] := MoveAStepBar /@ ParticleCoords;
NumFramesBarrier = 10;
NumFramesNoBarrier = 50;
NumFrames = NumFramesBarrier + NumFramesNoBarrier;
ParticleCoordinatesTable = Table[0, {i, 1, NumFrames}];
ParticleCoordinatesTable[[1]] = InitParticleCoordinates;
For[i = 2, i <= NumFrames, i++,
  If[i <= NumFramesBarrier,
   ParticleCoordinatesTable[[i]] = NextParticleCoordinatesBar[ParticleCoordinatesTable[[i - 1]]], 
   ParticleCoordinatesTable[[i]] = NextParticleCoordinates[ParticleCoordinatesTable[[i - 1]]]];];

(*Plot full particle simulation*)
makeplotbar[ParticleCoord_] := 
  ListPlot[{ParticleCoord, {{xStartMax, 0}, {xStartMax, yMax}}}, Frame -> True, Axes -> False,
   PlotRange -> {{0, xMax}, {0, yMax}}, Joined -> {False, True}, PlotStyle -> {PointSize[.03], Thick},
   AspectRatio -> yMax/xMax, FrameTicks -> None];

makeplot[ParticleCoord_] := 
 ListPlot[ParticleCoord, Frame -> True, Axes -> False, PlotRange -> {{0, xMax}, {0, yMax}}, Joined -> False, 
  PlotStyle -> PointSize[.03], AspectRatio -> yMax/xMax, FrameTicks -> None]

ParticlesPlots = 
  Join[Table[makeplotbar[ParticleCoordinatesTable[[i]]], {i, 1, NumFramesBarrier}], 
   Table[makeplot[ParticleCoordinatesTable[[i]]], {i, NumFramesBarrier + 1, NumFrames}]];

(*Plot just the first particle in the list...Actually the fifth particle looks better. *) 
FirstParticleTable = {#[[5]]} & /@ ParticleCoordinatesTable;

FirstParticlePlots = 
  Join[Table[makeplotbar[FirstParticleTable[[i]]], {i, 1, NumFramesBarrier}], 
   Table[makeplot[FirstParticleTable[[i]]], {i, NumFramesBarrier + 1, NumFrames}]];


(* Continuum solution *)

(* I can use the simple diffusion-on-an-infinite-line formula, as long as I correctly periodically replicate the
initial condition. Actually just computed nearest five replicas in each direction, that was a fine approximation. *)

(* k = diffusion coefficient, visually matched to simulation. *)
k = .0007; 
u[x_, t_] := If[t == 0, If[x <= xStartMax, 1, 0], 1/2 Sum[
     Erf[(x - (-xStartMax + 2 n xMax))/Sqrt[4 k t]] - Erf[(x - (xStartMax + 2 n xMax))/Sqrt[4 k t]], {n, -5, 5}]];

ContinuumPlots = Join[
   Table[Show[
     DensityPlot[1 - u[x, 0], {x, 0, xMax}, {y, 0, yMax}, 
      ColorFunctionScaling -> False, AspectRatio -> yMax/xMax, 
      FrameTicks -> None],
     ListPlot[{{xStartMax, 0}, {xStartMax, yMax}}, Joined -> True, 
      PlotStyle -> {Thick, Purple}]],
    {i, 1, NumFramesBarrier}],
   Table[
    DensityPlot[1 - u[x, tt], {x, 0, xMax}, {y, 0, yMax}, 
     ColorFunctionScaling -> False, AspectRatio -> yMax/xMax, 
     FrameTicks -> None],
    {tt, 1, NumFramesNoBarrier}]];

(*Combine and export *)

TogetherPlots = 
  Table[GraphicsGrid[{{FirstParticlePlots[[i]]}, {ParticlesPlots[[i]]}, {ContinuumPlots[[i]]}},
   Spacings -> Scaled[0.2]], {i, 1, NumFrames}];

Export["test.gif", Join[TogetherPlots, Table[Graphics[], {i, 1, 5}]], 
 "DisplayDurations" -> {10}, "AnimationRepititions" -> Infinity ]

설명

이 파일이 나타내는 바에 대한 한 줄 설명을 추가합니다

이 파일에 묘사된 항목

다음을 묘사함

파일 역사

날짜/시간 링크를 클릭하면 해당 시간의 파일을 볼 수 있습니다.

날짜/시간섬네일크기사용자설명
현재2012년 3월 7일 (수) 22:412012년 3월 7일 (수) 22:41 판의 섬네일360 × 300 (402 KB)Dratini0Just removed the white last fram for aesthetic purposes, and prologed the display time of the last frame to mark the reatart of the animation.
2010년 3월 26일 (금) 04:372010년 3월 26일 (금) 04:37 판의 섬네일360 × 300 (402 KB)AiyizoOptimized animation, converted to 256 color mode
2010년 1월 16일 (토) 18:572010년 1월 16일 (토) 18:57 판의 섬네일360 × 300 (529 KB)Sbyrnes321sped up bottom panel to match better with middle panel
2010년 1월 16일 (토) 18:462010년 1월 16일 (토) 18:46 판의 섬네일360 × 300 (508 KB)Sbyrnes321{{Information |Description={{en|1=Diffusion from a microscopic and macroscopic point of view. Initially, there are solute molecules on the left side of a barrier (purple line) and none on the right. The barrier is removed, and the solute diffuses to fill

다음 문서 1개가 이 파일을 사용하고 있습니다:

이 파일을 사용하고 있는 모든 위키의 문서 목록

다음 위키에서 이 파일을 사용하고 있습니다:

이 파일의 더 많은 사용 내역을 봅니다.