
파일:Births and Total fertility rate of Japan.svg

SVG 파일의 PNG 형식의 미리보기 크기: 800 × 400 픽셀. 다른 해상도: 320 × 160 픽셀 | 640 × 320 픽셀 | 1,024 × 512 픽셀 | 1,280 × 640 픽셀 | 2,560 × 1,280 픽셀 | 900 × 450 픽셀
원본 파일 (SVG 파일, 실제 크기 900 × 450 픽셀, 파일 크기: 117 KB)

|
이 파일은 최신 정보를 받아서 업데이트될 가능성이 있습니다. 새로운 업데이트가 반영되는 것 없이, 특정 판의 파일을 사용한 경우에는, 필요한 판을 다른 파일로서 업로드해주세요. |
파일 설명
| 설명 |
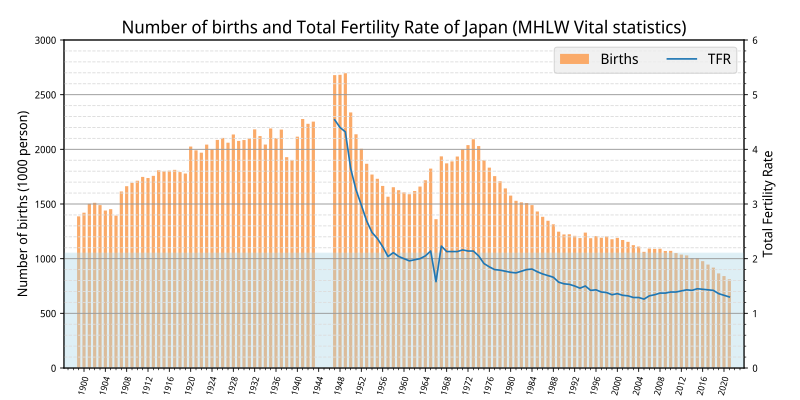
English: Births and Total fertility rate of Japan |
| 날짜 | |
| 출처 |
자작, Data from
|
| 저자 | Yuasan |
| 저작권 (이 파일을 인용하기) |
CC-0 |
라이선스
나는 아래 작품의 저작권자로서, 이 저작물을 다음과 같은 라이선스로 배포합니다:
| 이 파일은 크리에이티브 커먼즈 CC0 1.0 보편적 퍼블릭 도메인 귀속에 따라 이용할 수 있습니다. | |
| 저작물에 본 권리증서를 첨부한 자는 법률에서 허용하는 범위 내에서 저작인접권 및 관련된 모든 권리들을 포함하여 저작권법에 따라 전 세계적으로 해당 저작물에 대해 자신이 갖는 일체의 권리를 포기함으로써 저작물을 퍼블릭 도메인으로 양도하였습니다. 저작권자의 허락을 구하지 않아도 이 저작물을 상업적인 목적을 포함하여 모든 목적으로 복제, 수정·변경, 배포, 공연·실연할 수 있습니다.
|
graph data
import matplotlib.pyplot as plt
from cycler import cycler
import pandas as pd
import numpy as np

df = pd.read_csv("data.tsv", index_col=0 , sep = "\t")

df1 = df.T.loc['TFR']		# line
df1 = df1.fillna(method='ffill')
df2 = df.T.loc['Births'].div(1000)	# bar

fig, ax = plt.subplots(figsize=(10, 5))
ax2 = ax.twinx()
plt.rcParams['font.family'] = 'sans-serif'
plt.rcParams['font.sans-serif'] = ['Noto Sans Display']

plt.subplots_adjust(left=0.08, bottom=0.08, right=0.93, top=0.90)

ax.bar(df2.index, df2, color="#FAAA69", width=0.6, label="Births")
ax.set_axisbelow(True)
ax.tick_params(axis='x', labelrotation=75)
ax.set_ylabel("Number of births (1000 person)", fontsize=12)
ax.set_ylim([0,3000])

ax2.set_ylabel("Total Fertility Rate", fontsize=12)
ax2.set_ylim([0,6])
ax2.axhspan(0,2.1, color="lightblue", alpha=0.4 , zorder=-10)
ax2.set_prop_cycle( plt.rcParams['axes.prop_cycle'] )
ax2.plot(df1, label="TFR")

ax.margins(0.02)
ax2.margins(0.02)

lines, labels = ax.get_legend_handles_labels()
lines2, labels2 = ax2.get_legend_handles_labels()
ax2.legend(lines + lines2, labels + labels2, facecolor="#eeeeee" ,
           ncol=2, fontsize=13,loc='upper right')

plt.title("Number of births and Total Fertility Rate of Japan (MHLW Vital statistics)", fontsize=16)

plt.setp(ax.get_xticklabels(), fontsize=8)
plt.setp(ax.get_yticklabels(), fontsize=9)
plt.xticks(np.arange(1900, 2021, step=4), fontsize=9)
plt.tick_params(labelsize=9, pad=4)

plt.minorticks_on()
plt.grid(which='major',color='#999999',linestyle='-', axis="y")
plt.grid(which='minor',color='#dddddd',linestyle='--', axis="y")

plt.savefig("image.svg")
파일 역사
날짜/시간 링크를 클릭하면 해당 시간의 파일을 볼 수 있습니다.
| 날짜/시간 | 섬네일 | 크기 | 사용자 | 설명 | |
|---|---|---|---|---|---|
| 현재 | 2023년 8월 1일 (화) 22:31 | | 900 × 450 (117 KB) | Yuasan | stretch |
| 2023년 1월 3일 (화) 21:47 |  | 1,080 × 540 (121 KB) | Yuasan | ipss data | |
| 2023년 1월 3일 (화) 21:25 |  | 1,080 × 540 (121 KB) | Yuasan | fix TFR | |
| 2022년 12월 30일 (금) 22:51 |  | 1,080 × 540 (89 KB) | Yuasan | Uploaded own work with UploadWizard |
이 파일을 사용하는 문서
다음 문서 1개가 이 파일을 사용하고 있습니다:
이 파일을 사용하고 있는 모든 위키의 문서 목록
다음 위키에서 이 파일을 사용하고 있습니다:
- en.wikipedia.org에서 이 파일을 사용하고 있는 문서 목록
- it.wikipedia.org에서 이 파일을 사용하고 있는 문서 목록
- ja.wikipedia.org에서 이 파일을 사용하고 있는 문서 목록
- uk.wikipedia.org에서 이 파일을 사용하고 있는 문서 목록
- zh.wikipedia.org에서 이 파일을 사용하고 있는 문서 목록