
파일:South Africa 2001 dominant language map.svg

SVG 파일의 PNG 형식의 미리보기 크기: 689 × 600 픽셀. 다른 해상도: 276 × 240 픽셀 | 552 × 480 픽셀 | 882 × 768 픽셀 | 1,177 × 1,024 픽셀 | 2,353 × 2,048 픽셀 | 1,072 × 933 픽셀
원본 파일 (SVG 파일, 실제 크기 1,072 × 933 픽셀, 파일 크기: 1,024 KB)
파일 설명
| 설명 |
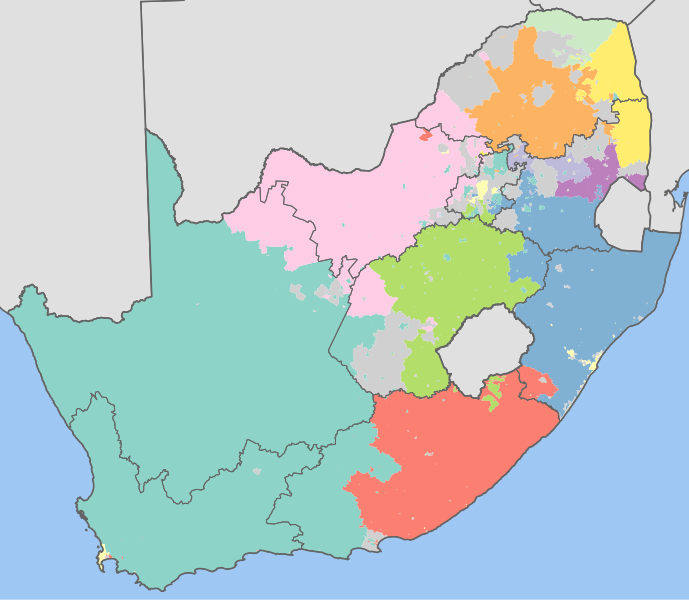
English: Map showing the dominant home languages in South Africa, according to Census 2001 at the "Main Place" level. In this context, a language is dominant if it more than 50% of the population in an area speak it at home, or more than 33% speak it and no other language is spoken by more than 25%.
Afrikaans
English
isiNdebele
isiXhosa
isiZulu
Sesotho sa Leboa
Sesotho
Setswana
siSwati
Tshivenda
Xitsonga
No language dominant
Projection is Albers Equal-Area Conic, with standard parallels at 25.5° S and 31.5° S, and origin at 28.5° S 25.5° E. |
| 날짜 | |
| 출처 | Statistics South Africa's Census 2001 is the source of the basic population data. The map results from my own processing of the data. |
| 저자 | Htonl |
라이선스
The following license applies to the population data on which the map is based:

|
이 파일의 저작권자인 Stats SA은 저작권자를 명시하는 조건에 따라 누구에게나 어떤 목적으로든지 제한 없이 사용할 수 있도록 허용하였습니다. 재배포나 이차적 저작물 작성 및 상업적 이용 등이 허용됩니다. |
저작자표시:
"the user acknowledges Stats SA as the source of the basic data wherever they process, apply, utilise, publish or distribute the data, and also that they specify that the relevant application and analysis (where applicable) result from their own processing of the data" [1]
|
The following tag applies to the map itself:
| 나는 이 작품의 저작권자로서, 이 작품을 퍼블릭 도메인으로 모두에게 공개합니다. 이 공개 선언은 전 세계적으로 유효합니다. 만약 저작권의 포기가 법률적으로 가능하지 않은 경우, 나는 이 작품을 법적으로 허용되는 한도 내에서 누구나 자유롭게 어떤 목적으로도 제한없이 사용할 수 있도록 허용합니다. |
파일 역사
날짜/시간 링크를 클릭하면 해당 시간의 파일을 볼 수 있습니다.
| 날짜/시간 | 섬네일 | 크기 | 사용자 | 설명 | |
|---|---|---|---|---|---|
| 현재 | 2010년 11월 29일 (월) 20:42 | | 1,072 × 933 (1,024 KB) | Htonl | tweak |
| 2010년 10월 2일 (토) 23:18 |  | 1,072 × 933 (1.02 MB) | Htonl | new approach, smaller filesize | |
| 2010년 10월 2일 (토) 06:51 |  | 1,072 × 933 (2.92 MB) | Htonl | Reverted to version as of 17:41, 1 October 2010 | |
| 2010년 10월 2일 (토) 06:33 |  | 1,072 × 933 (2.79 MB) | Htonl | tweak | |
| 2010년 10월 2일 (토) 02:41 |  | 1,072 × 933 (2.92 MB) | Htonl | use equal-area projection | |
| 2010년 2월 17일 (수) 03:50 |  | 1,000 × 786 (2.81 MB) | Htonl | tweak | |
| 2010년 2월 8일 (월) 04:49 |  | 1,000 × 786 (3.04 MB) | Htonl | and again | |
| 2010년 2월 8일 (월) 04:43 |  | 1,000 × 786 (3.04 MB) | Htonl | change "none" colour | |
| 2010년 2월 7일 (일) 09:50 |  | 1,000 × 786 (3.04 MB) | Htonl | =={{int:filedesc}}== {{Information |Description={{en|1=Map showing the dominant homelanguages in South Africa, according to Census 2001 at the "Main Place" level. In this context, a language is dominant if it more than 50% of the population in an area spe |
이 파일을 사용하는 문서
이 파일을 사용하는 문서가 없습니다.
이 파일을 사용하고 있는 모든 위키의 문서 목록
다음 위키에서 이 파일을 사용하고 있습니다:
- zh.wikipedia.org에서 이 파일을 사용하고 있는 문서 목록