
파일:Effect of circular convolution on discrete Hilbert transform.png

미리 보기 크기: 800 × 421 픽셀 다른 해상도: 320 × 168 픽셀 | 640 × 337 픽셀 | 1,156 × 608 픽셀
원본 파일 (1,156 × 608 픽셀, 파일 크기: 100 KB, MIME 종류: image/png)
파일 설명
| 설명 |
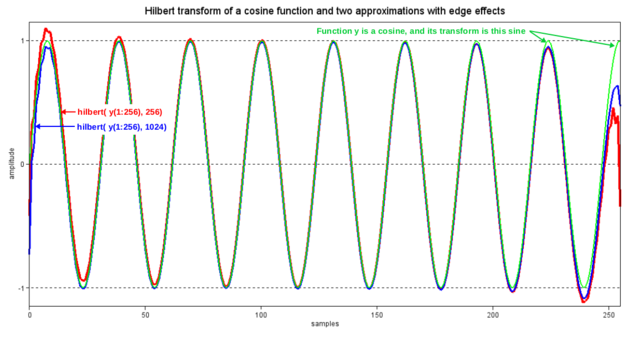
English: The Hilbert transform of cos(ωt) is sin(ωt). When a finite segment of cos(ωt) is transformed, edge effects inevitably occur. Using a segment length of 256 samples, this figure shows a sine function and two approximate Hilbert transforms computed by the MATLAB library function, hilbert(·), which supports optional zero-filling of the segment to be transformed. The red graph is the result of no zero-filling, and the blue graph is the result of 300% zero-filling. In the latter case, the edge effects are almost all due to the rise and fall times of the Hilbert transform's 2/(πn) impulse response. In the "red" case, we have the added effect of circular convolution. In other words, in the blue case, distortion occurs when some of the filter taps are coinciding with zeros, instead of with samples of cos(ωt). And in the red case, those same taps are coinciding with wrapped-around (and out-of-phase) samples of cos(ωt). |
|||
| 날짜 | ||||
| 출처 | 자작 | |||
| 저자 | Bob K | |||
| 저작권 (이 파일을 인용하기) |
나는 아래 작품의 저작권자로서, 이 저작물을 다음과 같은 라이선스로 배포합니다:
|
|||
| PNG 발전 | 이 PNG 컴퓨터 그래픽스는 LibreOffice(으)로 제작되었습니다. |
|||
| Source file | Scilab codeN=256;
x=0:N-1;
cycles_per_segment = 8.2888; // empirical value that displays edge effects well
cycles_per_sample = cycles_per_segment/N;
Yreal = cos(2*%pi*cycles_per_sample*x); // function to be transformed
Ans = sin(2*%pi*cycles_per_sample*x); // the ideal answer
H1 = imag(hilbert(Yreal)); // no zero-filling
H2 = imag(hilbert([Yreal zeros(1,1024-N)])); // zero-filling
// Display the results
red=5; blue=2; green=3; black=1; // based on a call to getcolor()
top=green; middle=blue; bottom=red;
plot2d(x', [H1' H2(1:N)' Ans'], style=[bottom middle top], rect=[0,-1.15,N-1,1.15]);
a = gca();
a.box = "on";
a.font_size=2; //set the tics label font size
a.visible = "on";
a.grid = [-1,0];
a.auto_ticks = ["off","off","off"]
a.y_ticks = tlist(["ticks", "locations", "labels"], [-1 0 1], ["-1" "0" "1"]);
a.x_ticks = tlist(["ticks", "locations", "labels"], [0 50 100 150 200 250], ["0" "50" "100" "150" "200" "250"]);
//a.children.children.thickness=2; // set line thickness of plots
top=1; middle=2; bottom=3;
a.children.children(top).thickness=2;
a.children.children(middle).thickness=3;
a.children.children(bottom).thickness=4;
xlabel("samples", "fontsize", 2)
ylabel("amplitude", "fontsize", 2)
title("Hilbert transform of a cosine function and two approximations with edge effects", "fontsize", 4)
|
See also
파일 역사
날짜/시간 링크를 클릭하면 해당 시간의 파일을 볼 수 있습니다.
| 날짜/시간 | 섬네일 | 크기 | 사용자 | 설명 | |
|---|---|---|---|---|---|
| 현재 | 2016년 2월 9일 (화) 19:58 | | 1,156 × 608 (100 KB) | Bob K | Show the sine function and 2 approximations, instead of the 2 difference functions. |
| 2015년 4월 11일 (토) 00:34 |  | 1,083 × 570 (23 KB) | Bob K | The new figure compares two different error functions, one with zero-filling and one without. | |
| 2012년 9월 14일 (금) 10:26 |  | 1,139 × 636 (9 KB) | Bob K | shift horizontal scale by 1 | |
| 2012년 9월 14일 (금) 09:48 |  | 1,134 × 632 (9 KB) | Bob K | Larger font size for labels | |
| 2012년 9월 14일 (금) 07:51 |  | 1,119 × 610 (7 KB) | Bob K | User created page with UploadWizard |
이 파일을 사용하는 문서
다음 문서 1개가 이 파일을 사용하고 있습니다:
이 파일을 사용하고 있는 모든 위키의 문서 목록
다음 위키에서 이 파일을 사용하고 있습니다:
- en.wikipedia.org에서 이 파일을 사용하고 있는 문서 목록
- zh.wikipedia.org에서 이 파일을 사용하고 있는 문서 목록