
파일:Cartogram—2012 Electoral Vote.svg

원본 파일 (SVG 파일, 실제 크기 1,272 × 1,002 픽셀, 파일 크기: 252 KB)
파일 설명
| 설명 |
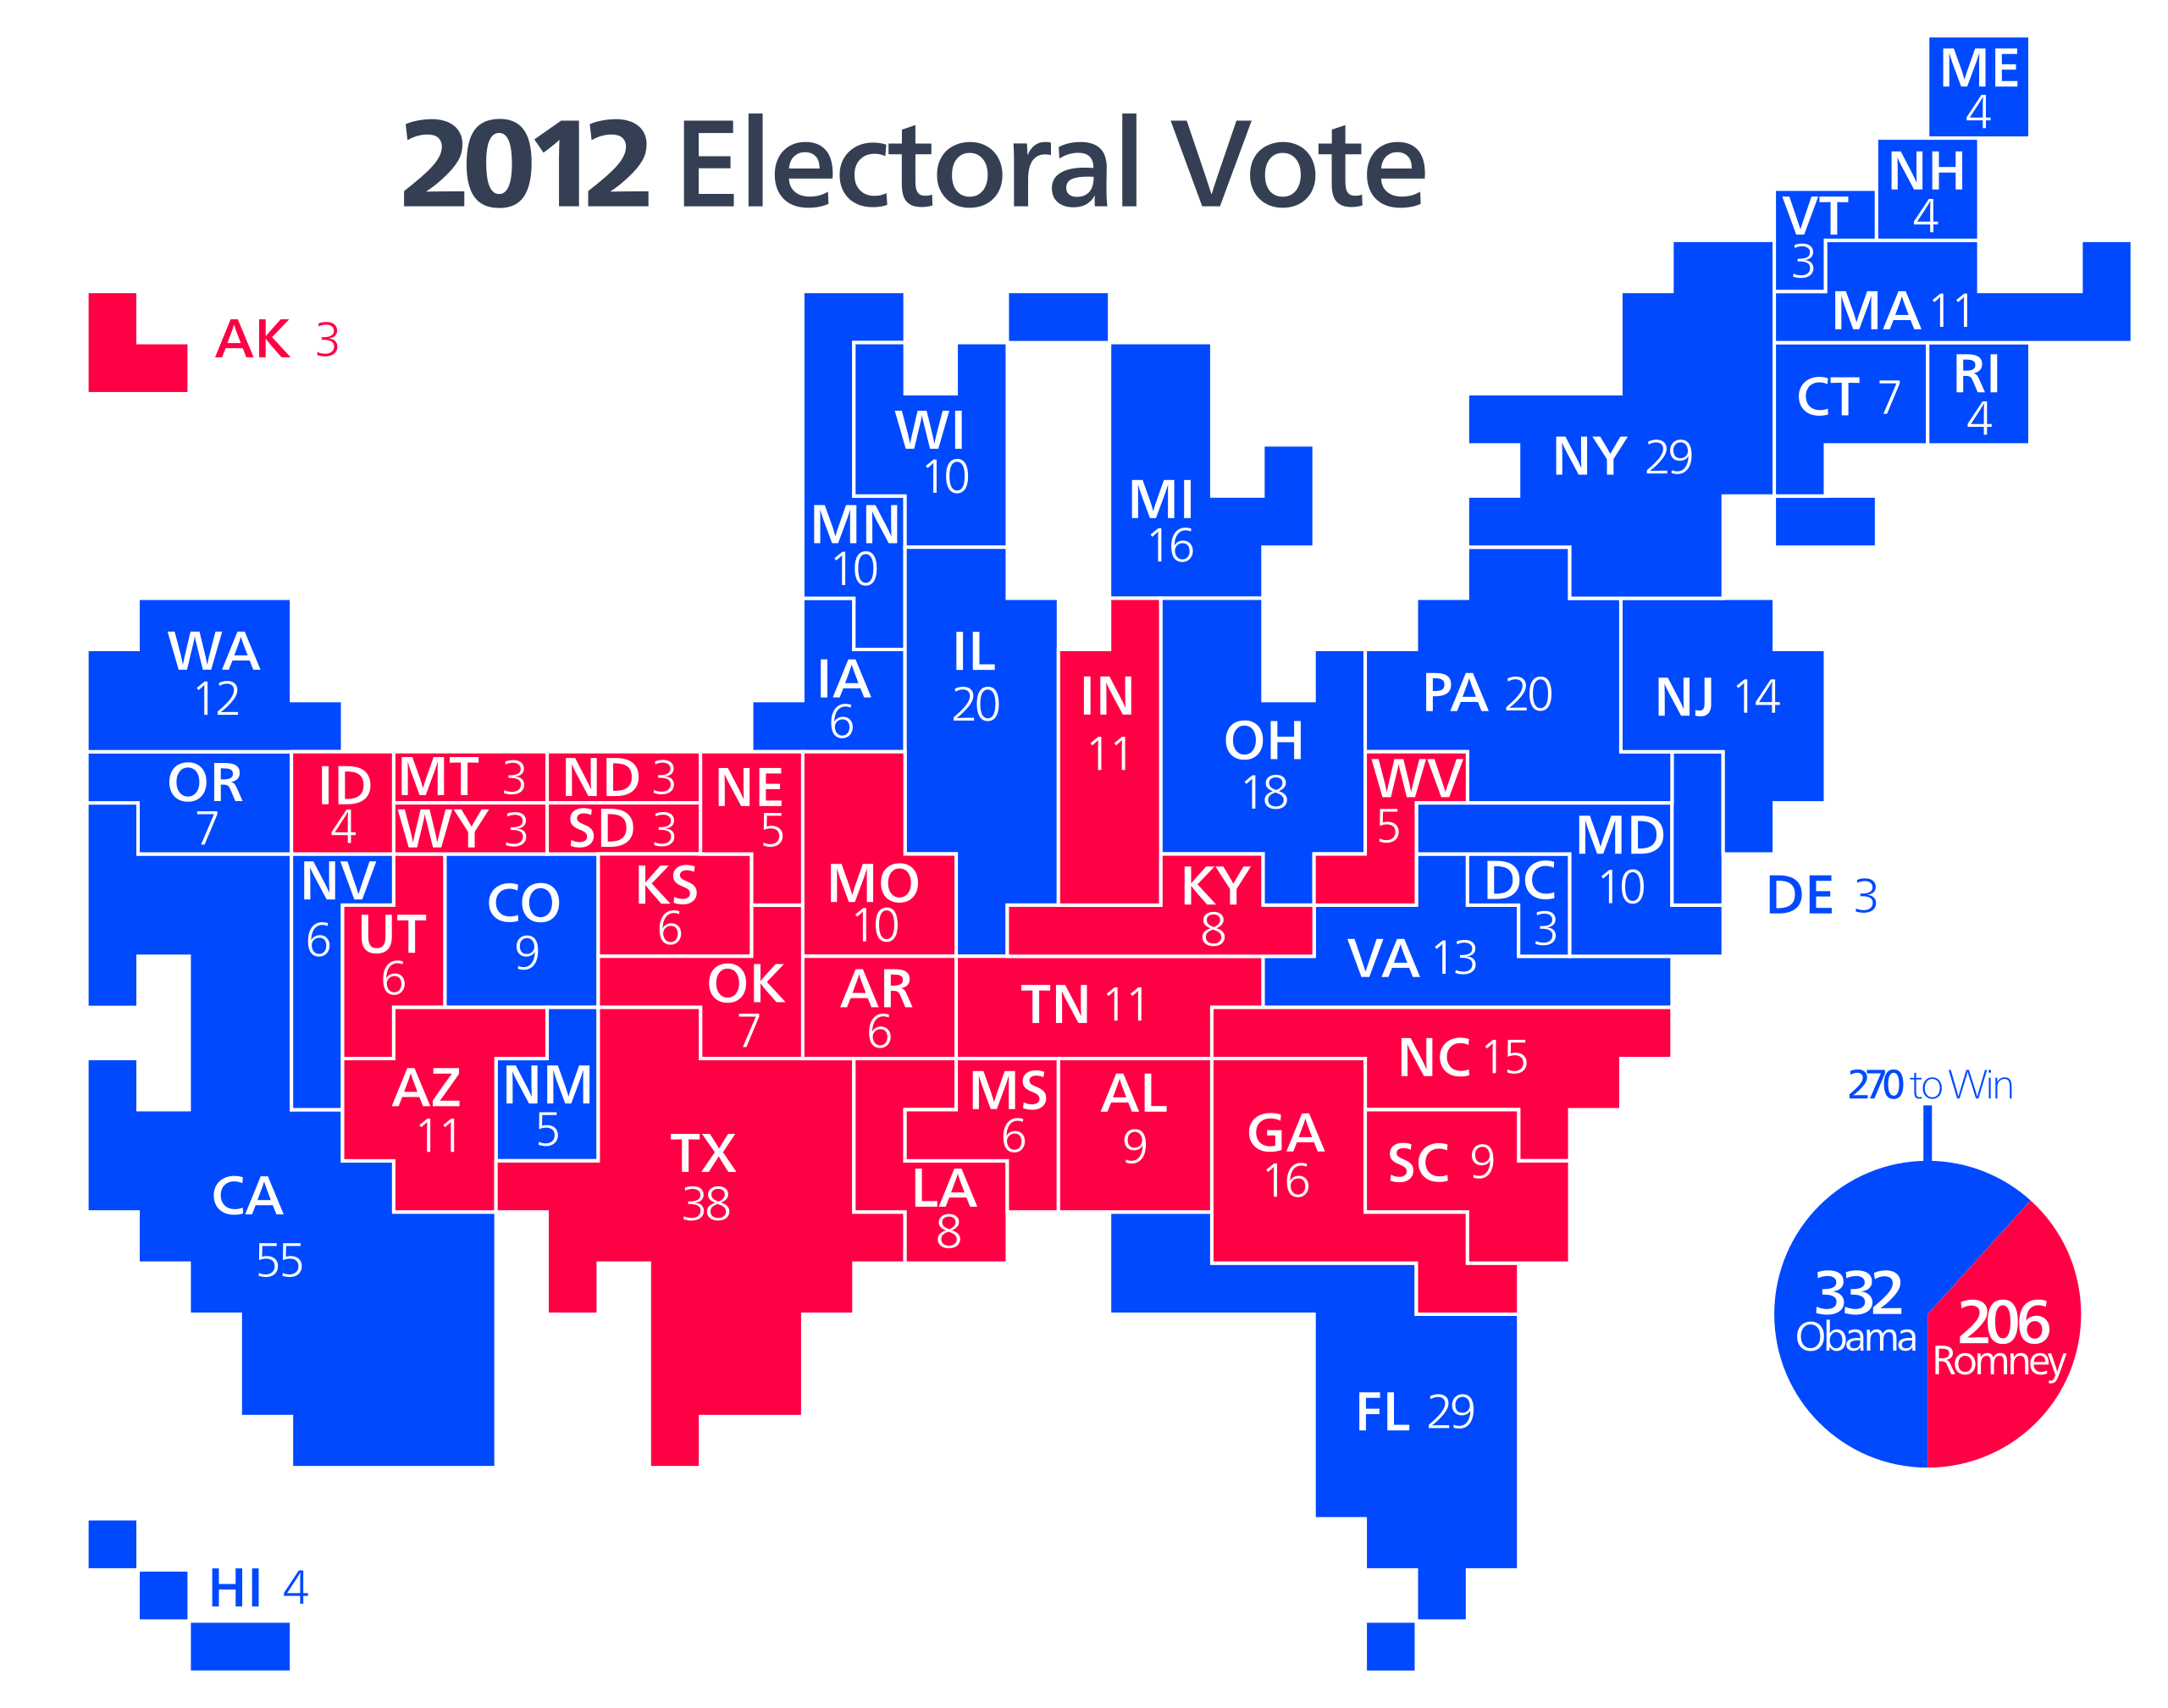
English: Cartogram of the 2012 Electoral Vote for US President, with each square representing one electoral vote.
The population density of the 50 states varies by three orders of magnitude (from NJ with nearly 1,200 people per square mile, to AK with roughly 1 1/4 people per sq mi). Because of that huge variation, a regular map of the US that is typically used to present electoral vote results can convey a very skewed impression of the outcome where sparsely populated states appear overrepresented and densely populated states appear underrepresented. The cartogram approach of this image eliminates that problem by presenting the area of each state in an exact one-to-one correspondence with its number of electoral votes. But this is achieved at the cost of introducing distortions to the actual shape of each state and their positioning in relation to each other. This map is an SVG reconstruction of this one.Español: Un cartograma del voto electoral para el presidente de los EEUU. Cada cuadrado representa un voto electoral.
Las densidades de pobulación de los 50 estados varían según tres ordenes de magnitud (desde Nueva Jersey que tiene 1.200 personas por milla cuadrada, a Alaska que tiene cerca de 1,25 personas por milla cuadrada). Debido a que esa variación gigante, un mapa normal de los EEUU que suele se usa para mostrar el voto electoral puede dar un impresión muy distorsionada del resultado. Estados con baja densidad de población aparecen sobrerrepresentados, y stados con alta densidad de población aparecen subrepresentados. Usar un cartograma elimina ese problema al través de mostrar el área de cada estado según su cantidad de votos electorales en un proporción 1:1 exacta, aunque esto se logra a costa de introducir distorciones a la forma verdad de cada estado y sus disposiciónes. Este mapa es un reconstrucción en SVG de este diagrama. |
| 날짜 | |
| 출처 | File:2012 Electoral Vote-Cartogram.png |
| 저자 | Kelvinsong |
라이선스
| 이 파일은 크리에이티브 커먼즈 CC0 1.0 보편적 퍼블릭 도메인 귀속에 따라 이용할 수 있습니다. | |
| 저작물에 본 권리증서를 첨부한 자는 법률에서 허용하는 범위 내에서 저작인접권 및 관련된 모든 권리들을 포함하여 저작권법에 따라 전 세계적으로 해당 저작물에 대해 자신이 갖는 일체의 권리를 포기함으로써 저작물을 퍼블릭 도메인으로 양도하였습니다. 저작권자의 허락을 구하지 않아도 이 저작물을 상업적인 목적을 포함하여 모든 목적으로 복제, 수정·변경, 배포, 공연·실연할 수 있습니다.
|
파일 역사
날짜/시간 링크를 클릭하면 해당 시간의 파일을 볼 수 있습니다.
| 날짜/시간 | 섬네일 | 크기 | 사용자 | 설명 | |
|---|---|---|---|---|---|
| 현재 | 2012년 11월 26일 (월) 05:30 | | 1,272 × 1,002 (252 KB) | IsadoraofIbiza | User created page with UploadWizard |
이 파일을 사용하는 문서
다음 문서 1개가 이 파일을 사용하고 있습니다:
이 파일을 사용하고 있는 모든 위키의 문서 목록
다음 위키에서 이 파일을 사용하고 있습니다:
- ca.wikipedia.org에서 이 파일을 사용하고 있는 문서 목록
- en.wikipedia.org에서 이 파일을 사용하고 있는 문서 목록
- it.wikipedia.org에서 이 파일을 사용하고 있는 문서 목록
- ja.wikipedia.org에서 이 파일을 사용하고 있는 문서 목록
- ms.wikipedia.org에서 이 파일을 사용하고 있는 문서 목록