
파일:Butterworth response.svg

SVG 파일의 PNG 형식의 미리보기 크기: 512 × 384 픽셀. 다른 해상도: 320 × 240 픽셀 | 640 × 480 픽셀 | 1,024 × 768 픽셀 | 1,280 × 960 픽셀 | 2,560 × 1,920 픽셀
원본 파일 (SVG 파일, 실제 크기 512 × 384 픽셀, 파일 크기: 41 KB)
파일 설명
| 설명 |
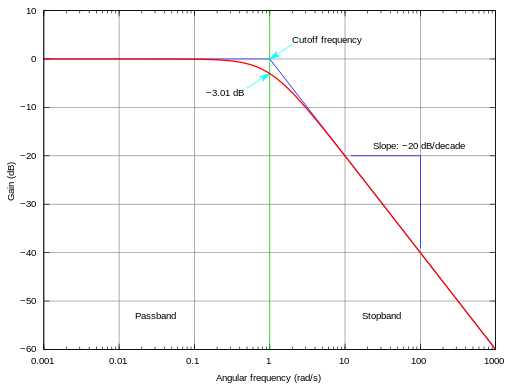
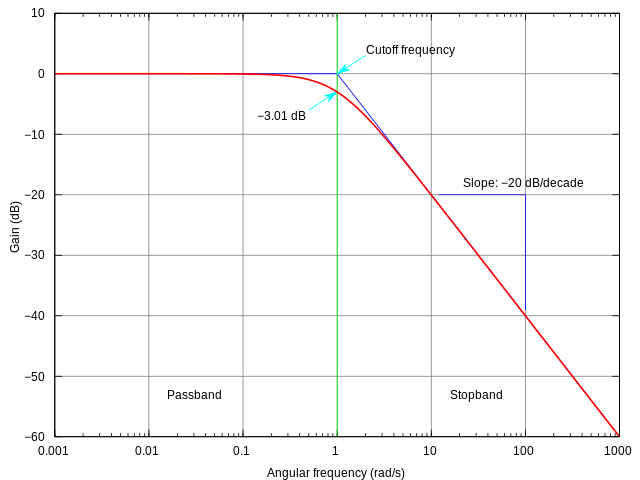
English: This is the SVG version of the PNG image created by Omegatron.
I simply changed the terminal type from PostScript to SVG in the gnuplot script file. The frequency response of a Butterworth filter with logarithmic axes (Bode plot) and various labels. Cutoff frequency is normalized to 1 rad/s. Gain is normalized to 0 dB in the passband.
|
||||
| 날짜 | (UTC) | ||||
| 출처 | |||||
| 저자 |
|
||||
| 다른 버전 |
|
||||
| gnuplot source | click to expand
set samples 2001
# set terminal postscript enhanced landscape color lw 2 "Times-Roman" 20
set terminal svg size 800 600 dynamic enhanced
set output "butterworth.svg"

# Butterworth amplitude response and decibel calculation.  n is the order, which is just 1 in this image.
G(w,n) = 1 / (sqrt(1 + w**(2*n)))
dB(x) = 20 * log10(abs(x))

# Gridlines
set grid

# Set x axis to logarithmic scale
set logscale x 10

# Set range of x and y axes
set xrange [0.001:1000]
set yrange [-60:10]

# Create x-axis tic marks once per decade (every multiple of 10)
set xtics 10

# Use 10 x-axis minor divisions per major division
set mxtics 10

# Axis labels
set xlabel "Angular frequency (rad/s)"
set ylabel "Gain (dB)"

# No need for a key
set nokey #0.1,-25

# Frequency response's line plotting style
set style line 1 lt 1 lw 2

# Draw a separator between passband and stopband and label them
set style line 2 lt 2 lw 1
set style arrow 2 nohead ls 2
set arrow 3 from 1,-60 to 1,10 as 2

# Label coordinates are relative to the graph window, not to the function, centered at the 1/4 and 3/4 width points
set label 1 "Passband" at graph 0.25, graph 0.1 c
set label 2 "Stopband" at graph 0.75, graph 0.1 c

# Asymptote lines and slope lines are the same "arrow" style
set style line 3 lt 3 lw 1
set style arrow 3 nohead ls 3

# Draw asymptote lines
set arrow 1 from 1,0 to 1000,-60 as 3
set arrow 2 from .001,0 to 1,0 as 3

# -3 dB arrow style and arrow
set style line 4 lt 4 lw 1
set style arrow 4 head filled size screen 0.02,15,45 ls 4
set arrow 4 from 2,3 to 1,0 as 4

# "Cutoff frequency" label uses same coordinates as the function
set label 3 "Cutoff frequency" at 2,4 l

# "-3 dB" label
set arrow 5 from 0.5,-6 to 1,-3 as 4
set label 4 "-3.01 dB" at 0.5,-7 r

# Draw slope lines and label
set arrow 6 from 100,-20 to 12,-20 as 3
set arrow 7 from 100,-20 to 100,-39 as 3
set label 5 "Slope: -20 dB/decade" at 100,-18 c

# Plot the filter response
plot
     dB(G(x,1)) ls 1  title "1st-order response"

unset output      # cleanup the handle
|


라이선스
나는 아래 작품의 저작권자로서, 이 저작물을 다음과 같은 라이선스로 배포합니다:
- 이용자는 다음의 권리를 갖습니다:
- 공유 및 이용 – 저작물의 복제, 배포, 전시, 공연 및 공중송신
- 재창작 – 저작물의 개작, 수정, 2차적저작물 창작
- 다음과 같은 조건을 따라야 합니다:
- 저작자표시 – 적절한 저작자 표시를 제공하고, 라이센스에 대한 링크를 제공하고, 변경사항이 있는지를 표시해야 합니다. 당신은 합리적인 방식으로 표시할 수 있지만, 어떤 방식으로든 사용권 허가자가 당신 또는 당신의 사용을 지지하는 방식으로 표시할 수 없습니다.
- 동일조건변경허락 – 만약 당신이 이 저작물을 리믹스 또는 변형하거나 이 저작물을 기반으로 제작하는 경우, 당신은 당신의 기여물을 원저작물과 동일하거나 호환 가능한 라이선스에 따라 배포하여야 합니다.

|
GNU 자유 문서 사용 허가서 1.2판 또는 자유 소프트웨어 재단에서 발행한 이후 판의 규정에 따라 본 문서를 복제하거나 개작 및 배포할 수 있습니다. 본 문서에는 변경 불가 부분이 없으며, 앞 표지 구절과 뒷 표지 구절도 없습니다. 본 사용 허가서의 전체 내용은 GNU 자유 문서 사용 허가서 부분에 포함되어 있습니다. |
이 라이선스 중에서 목적에 맞는 것을 선택하여 사용할 수 있습니다.
기존 올리기 기록
This image is a derivative work of the following images:
- Image:Butterworth_response.png licensed with Cc-by-sa-3.0,2.5,2.0,1.0, GFDL
- 2005-07-23T17:45:55Z Omegatron 1240x880 (87607 Bytes) split the cutoff frequency markers
- 2005-07-23T16:31:54Z Omegatron 1250x880 (94570 Bytes) Better butterworth filter response curve
- 2005-06-26T19:54:33Z Omegatron 250x220 (2251 Bytes) A graph or diagram made by [[User:Omegatron]]. (Uploaded with Wikimedia Commons.) Source: Created by [[User:Omegatron]] {{GFDL}}{{cc-by-sa-2.0}} [[Category:Diagrams]]\
Uploaded with derivativeFX
파일 역사
날짜/시간 링크를 클릭하면 해당 시간의 파일을 볼 수 있습니다.
| 날짜/시간 | 섬네일 | 크기 | 사용자 | 설명 | |
|---|---|---|---|---|---|
| 현재 | 2013년 4월 25일 (목) 18:50 | | 512 × 384 (41 KB) | Incnis Mrsi | dehyphenation |
| 2008년 7월 5일 (토) 08:17 |  | 512 × 384 (41 KB) | Krishnavedala | {{Information |Description=This is the en:SVG version of the en:PNG image created by en:User:Omegatron. I simply changed the terminal type from en:postscript to SVG in the en:GNUplot script file. The [[w:frequency response|frequency |
이 파일을 사용하는 문서
다음 문서 1개가 이 파일을 사용하고 있습니다:
이 파일을 사용하고 있는 모든 위키의 문서 목록
다음 위키에서 이 파일을 사용하고 있습니다:
- ca.wikipedia.org에서 이 파일을 사용하고 있는 문서 목록
- cv.wikipedia.org에서 이 파일을 사용하고 있는 문서 목록
- de.wikipedia.org에서 이 파일을 사용하고 있는 문서 목록
- en.wikipedia.org에서 이 파일을 사용하고 있는 문서 목록
- en.wikibooks.org에서 이 파일을 사용하고 있는 문서 목록
- eo.wikipedia.org에서 이 파일을 사용하고 있는 문서 목록
- es.wikipedia.org에서 이 파일을 사용하고 있는 문서 목록
- et.wikipedia.org에서 이 파일을 사용하고 있는 문서 목록
- fa.wikipedia.org에서 이 파일을 사용하고 있는 문서 목록
- fi.wikipedia.org에서 이 파일을 사용하고 있는 문서 목록
- pt.wikipedia.org에서 이 파일을 사용하고 있는 문서 목록
- simple.wikipedia.org에서 이 파일을 사용하고 있는 문서 목록
- su.wikipedia.org에서 이 파일을 사용하고 있는 문서 목록
- uk.wikipedia.org에서 이 파일을 사용하고 있는 문서 목록
- vi.wikipedia.org에서 이 파일을 사용하고 있는 문서 목록
- zh.wikipedia.org에서 이 파일을 사용하고 있는 문서 목록