
파일:Michelsonmorley-boxplot.svg

원본 파일 (SVG 파일, 실제 크기 432 × 432 픽셀, 파일 크기: 11 KB)
파일 설명
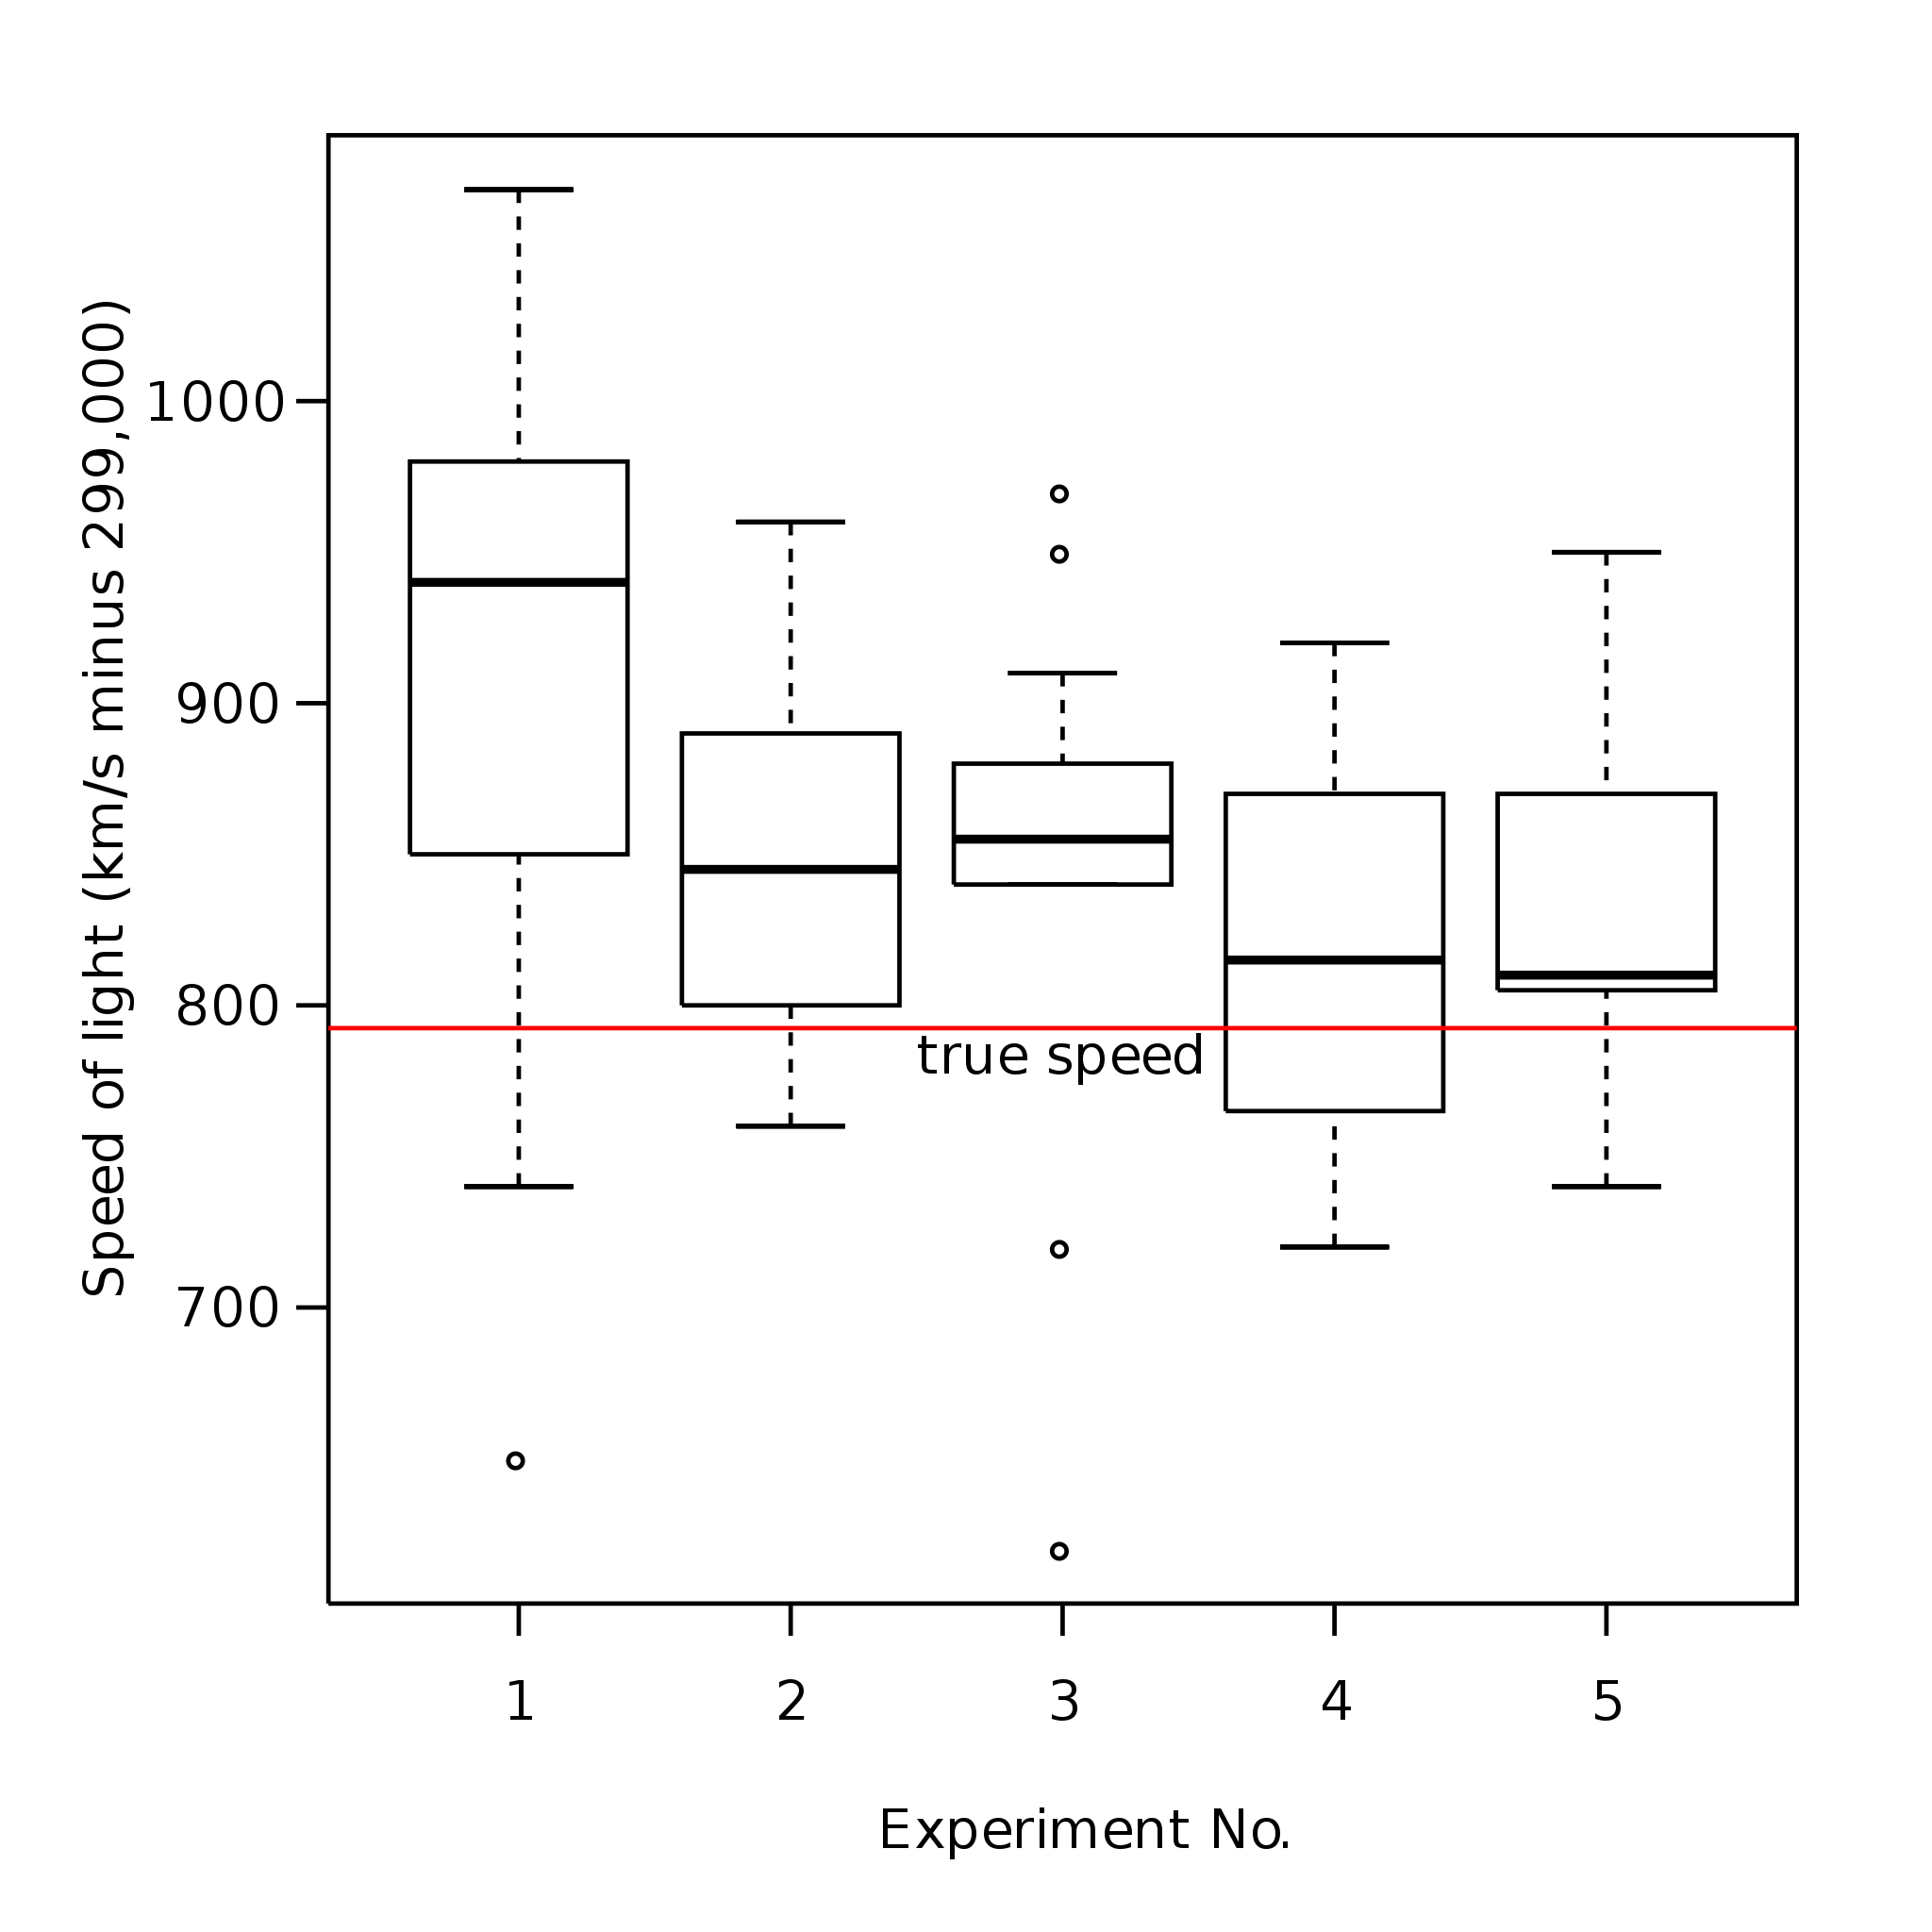
| 설명 | Boxplot representing Michelson's data on the speed of light. It consists of five experiments, each made of 20 consecutive runs. |
| 날짜 | |
| 출처 | 자작 |
| 저자 | User:Schutz |
| SVG 발전 |
This data is not from the Michelson-Morley experiment but from Michelson's measurement of the speed of light. See MICHELSON, A. A. (1882). Experimental determination of the velocity of light made at the United States Naval Academy, Annapolis. Astronomic Papers 1 pp. 109-145 U.S. Nautical Almanac Office, or S. M. Stigler (1977) Do robust estimators work with real data? Annals of Statistics 5, 1055–1098.
Original upload by User:Schutz
Boxplot representing Michelson's data on the speed of light. It consists of five experiments, each made of 20 consecutive runs. Note that the oblique line is incorrect, and probably due to a bug in the Mediawiki software/SVG converter. The graphic was created by User:Schutz for Wikipedia on 28 December 2006, using the R statistical project. The program that generated the graphic is given below; the data and the idea are from the R help page for the morley dataset (see help(morley)). The graph was exported in postscript format, converted to SVG using the pstoedit command, and the layout was slightly modified using Inkscape before upload.
  data(morley)
  morley$Expt <- factor(morley$Expt)
  morley$Run <- factor(morley$Run)
  attach(morley)

  postscript("Michelsonmorley-boxplot.ps", paper="special", height=6, width=6,
             horizontal=F)
  par(las=1)
  par(mar=c(5.1, 5.1, 2.1, 2.1))
  par(font=2)
  par(font.axis=2)
  boxplot(Speed ~ Expt, xlab = "Experiment No.", ylab="Speed of light (km/s minus 299,000)")
  abline(h=792.458, lty=3)
  dev.off()
New upload by User:Mwtoews
Boxplot representing Michelson's data on the speed of light. It consists of five experiments, each made of 20 consecutive runs.
The graphic was originally created by User:Schutz for Wikipedia on 28 December 2006, using the R statistical project. The program that generated the graphic is given below; the data and the idea are from the R help page for the morley dataset (see help(morley)). The graph was exported in PDF format, converted to SVG using Adobe Illustrator, and the layout was slightly modified using Vim before upload.
data(morley)
morley$Expt <- factor(morley$Expt)

pdf("Michelsonmorley-boxplot.pdf", height=6, width=6)
par(las=1, mar=c(5.1, 5.1, 2.1, 2.1))
boxplot(Speed ~ Expt, morley, xlab = "Experiment No.",
        ylab="Speed of light (km/s minus 299,000)")
abline(h=792.458, col="red")
text(3,792.458,"true\nspeed")
dev.off()
라이선스
| 나는 이 작품의 저작권자로서, 이 작품을 퍼블릭 도메인으로 모두에게 공개합니다. 이 공개 선언은 전 세계적으로 유효합니다. 만약 저작권의 포기가 법률적으로 가능하지 않은 경우, 나는 이 작품을 법적으로 허용되는 한도 내에서 누구나 자유롭게 어떤 목적으로도 제한없이 사용할 수 있도록 허용합니다. |
The creator and uploader also believes that this graphic is a trivial work which does not qualify for copyright.
Reference
- A. J. Weekes (1986) A Genstat Primer. London: Edward Arnold.
파일 역사
날짜/시간 링크를 클릭하면 해당 시간의 파일을 볼 수 있습니다.
| 날짜/시간 | 섬네일 | 크기 | 사용자 | 설명 | |
|---|---|---|---|---|---|
| 현재 | 2008년 5월 3일 (토) 19:25 | | 432 × 432 (11 KB) | Papa November | rm opaque bg. No copyright claimed for non-creative derivative work. |
| 2007년 10월 31일 (수) 06:30 |  | 432 × 432 (11 KB) | Mwtoews | ||
| 2007년 10월 31일 (수) 06:27 |  | 432 × 432 (11 KB) | Mwtoews | ||
| 2007년 10월 31일 (수) 06:24 |  | 432 × 432 (12 KB) | Mwtoews | ||
| 2006년 12월 29일 (금) 03:43 |  | 720 × 720 (19 KB) | Schutz |
이 파일을 사용하는 문서
다음 문서 3개가 이 파일을 사용하고 있습니다:
이 파일을 사용하고 있는 모든 위키의 문서 목록
다음 위키에서 이 파일을 사용하고 있습니다:
- ar.wikipedia.org에서 이 파일을 사용하고 있는 문서 목록
- ca.wikipedia.org에서 이 파일을 사용하고 있는 문서 목록
- cs.wikipedia.org에서 이 파일을 사용하고 있는 문서 목록
- cy.wikipedia.org에서 이 파일을 사용하고 있는 문서 목록
- da.wikipedia.org에서 이 파일을 사용하고 있는 문서 목록
- el.wiktionary.org에서 이 파일을 사용하고 있는 문서 목록
- en.wikipedia.org에서 이 파일을 사용하고 있는 문서 목록
- Summary statistics
- User:Rp
- Outlier
- Box plot
- Chart
- User:Andrevan
- User:Guaka
- User:M.e
- User:Jyril
- User:Peak Freak
- User:TMA~enwiki
- User:Val42
- User:Dreish
- User:Astronouth7303
- User:FuzzyBunny
- User:Wendell
- User:Kelisi
- User:Salix alba
- User:MichaelCaricofe
- User:NeonMerlin/boxes
- User:Kazikameuk
- User:Commander Nemet
- User:Emilio floris
- User:Burwellian
- User:Physicistjedi
- User:Bayerischermann
- User:Calilasseia
- User:ChildOfTheMoon83
- User:Hibernian
- User:Jcbarr
- User:Llewdor
- User:Richfife
- User:KnowledgeLord
- Data and information visualization
- Wikipedia:Userboxes/Mathematics
- User:Blarneytherinosaur/Userboxes
- User:Whitetigah
- User:TheObtuseAngleOfDoom/Userbox
- User:Estreya
- User:Faya/Userboxes
- User:Thistheman
- User:Rachel Ayres
- User:Drummmer42
이 파일의 더 많은 사용 내역을 봅니다.