
파일:GISS temperature 2000-09 lrg.png

미리 보기 크기: 800 × 400 픽셀 다른 해상도: 320 × 160 픽셀 | 640 × 320 픽셀 | 1,024 × 512 픽셀 | 1,280 × 640 픽셀 | 2,880 × 1,440 픽셀
원본 파일 (2,880 × 1,440 픽셀, 파일 크기: 545 KB, MIME 종류: image/png)
파일 설명
| 설명 |
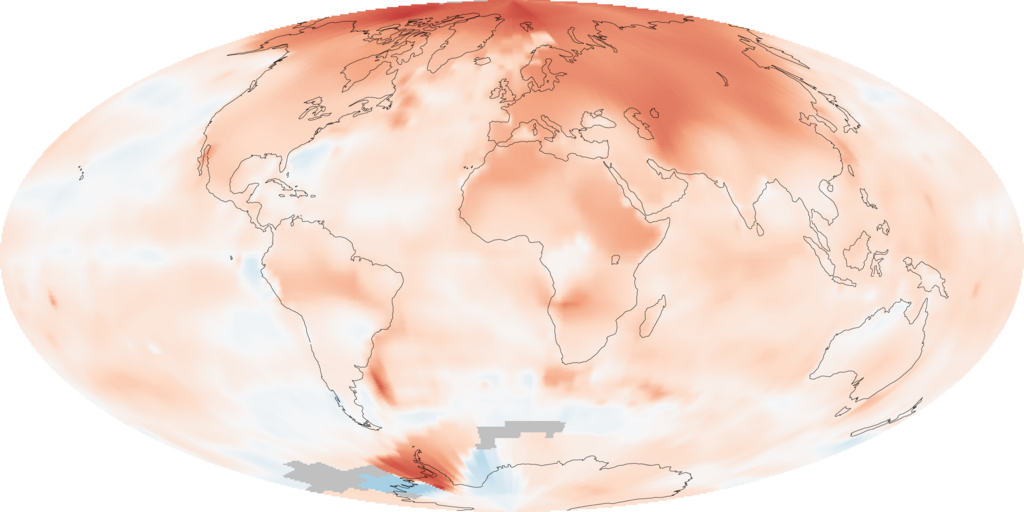
English: The map illustrates just how much warmer temperatures were in the decade (2000-2009) compared to average temperatures recorded between 1951 and 1980 (a common reference period for climate studies). The most extreme warming, shown in red, was in the Arctic. Very few areas saw cooler than average temperatures, shown in blue. Gray areas over parts of the Southern Ocean are places where temperatures were not recorded. The analysis, conducted by the Goddard Institute for Space Studies (GISS) in New York City, is based on temperatures recorded at meteorological (weather) stations around the world and satellite data over the oceans.
|
| 날짜 | |
| 출처 | NASA Earth Observatory Image of the Day: 2009 Ends Warmest Decade on Record http://earthobservatory.nasa.gov/IOTD/view.php?id=42392 |
| 저자 | NASA images by Robert Simmon, based on data from the Goddard Institute for Space Studies. |
라이선스
| 이 파일은 NASA에서 제작하였으므로 퍼블릭 도메인입니다. NASA의 저작권 정책에 따르면 NASA의 자료는 명시하지 않는 이상 저작권의 보호를 받지 않습니다. (Template:PD-USGov, 또는 NASA 저작권 정책 문서, JPL 그림 사용 정책을 참고하세요.) | ||
 |
주의사항:
|
파일 역사
날짜/시간 링크를 클릭하면 해당 시간의 파일을 볼 수 있습니다.
| 날짜/시간 | 섬네일 | 크기 | 사용자 | 설명 | |
|---|---|---|---|---|---|
| 현재 | 2010년 1월 23일 (토) 12:09 | | 2,880 × 1,440 (545 KB) | Petersam | {{Information |Description={{en|1=The map illustrate just how much warmer temperatures were in the decade (2000-2009) compared to average temperatures recorded between 1951 and 1980 (a common reference period for climate studies). The most extreme warming |
이 파일을 사용하는 문서
다음 문서 1개가 이 파일을 사용하고 있습니다:
이 파일을 사용하고 있는 모든 위키의 문서 목록
다음 위키에서 이 파일을 사용하고 있습니다:
- ar.wikipedia.org에서 이 파일을 사용하고 있는 문서 목록
- as.wikipedia.org에서 이 파일을 사용하고 있는 문서 목록
- bn.wikipedia.org에서 이 파일을 사용하고 있는 문서 목록
- bxr.wikipedia.org에서 이 파일을 사용하고 있는 문서 목록
- cs.wikipedia.org에서 이 파일을 사용하고 있는 문서 목록
- en.wikipedia.org에서 이 파일을 사용하고 있는 문서 목록
- en.wikiversity.org에서 이 파일을 사용하고 있는 문서 목록
- es.wikipedia.org에서 이 파일을 사용하고 있는 문서 목록
- fa.wikipedia.org에서 이 파일을 사용하고 있는 문서 목록
- fr.wikipedia.org에서 이 파일을 사용하고 있는 문서 목록
- id.wikipedia.org에서 이 파일을 사용하고 있는 문서 목록
- ilo.wikipedia.org에서 이 파일을 사용하고 있는 문서 목록
- it.wikipedia.org에서 이 파일을 사용하고 있는 문서 목록
- or.wikipedia.org에서 이 파일을 사용하고 있는 문서 목록
- pnb.wikipedia.org에서 이 파일을 사용하고 있는 문서 목록
- pt.wikipedia.org에서 이 파일을 사용하고 있는 문서 목록
- pt.wikinews.org에서 이 파일을 사용하고 있는 문서 목록
- si.wikipedia.org에서 이 파일을 사용하고 있는 문서 목록
- sv.wikipedia.org에서 이 파일을 사용하고 있는 문서 목록
- uk.wikipedia.org에서 이 파일을 사용하고 있는 문서 목록
- vi.wikipedia.org에서 이 파일을 사용하고 있는 문서 목록
- www.wikidata.org에서 이 파일을 사용하고 있는 문서 목록
- zh.wikipedia.org에서 이 파일을 사용하고 있는 문서 목록